

Question: fill up yellow cells that has question mark using formulas. Rocker Farms Income Statements For the Years 2019 and 2020 2020 Sales $370,000 Cost of
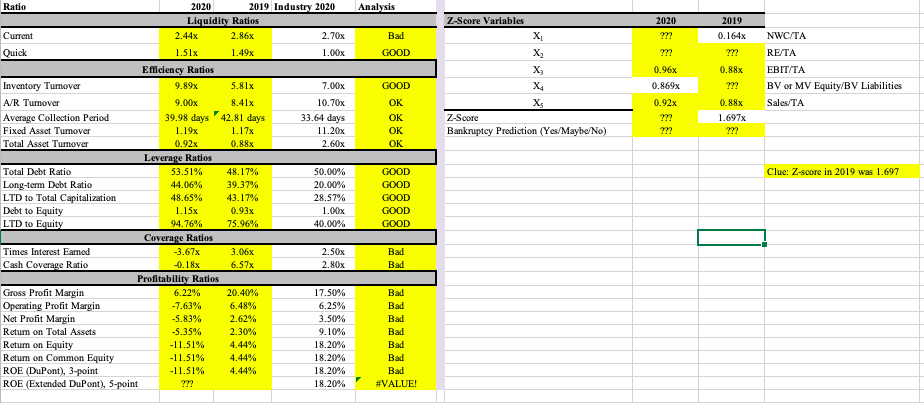 fill up yellow cells that has question mark using formulas.
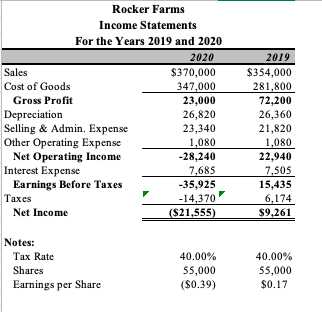
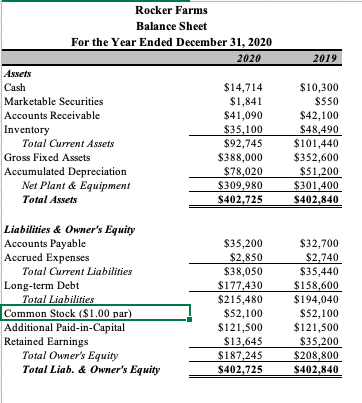
Rocker Farms Income Statements For the Years 2019 and 2020 2020 Sales $370,000 Cost of Goods 347,000 Gross Profit 23,000 Depreciation 26,820 Selling & Admin. Expense 23,340 Other Operating Expense 1,080 Net Operating Income -28,240 Interest Expense 7,685 Earnings Before Taxes -35,925 Taxes -14,370 Net Income ($21,555) 2019 $354,000 281,800 72,200 26,360 21,820 1,080 22,940 7,505 15,435 6,174 $9,261 Notes: Tax Rate Shares Earnings per Share 40.00% 55,000 ($0.39) 40.00% 55,000 $0.17 2019 Rocker Farms Balance Sheet For the Year Ended December 31, 2020 2020 Assets Cash $14,714 Marketable Securities $1,841 Accounts Receivable $41,090 Inventory $35,100 Total Current Assets $92,745 Gross Fixed Assets $388,000 Accumulated Depreciation $78,020 Net Plant & Equipment $309,980 Total Assets $402,725 $10,300 $550 $42,100 $48,490 $101,440 $352,600 $51,200 $301,400 $402,840 Liabilities & Owner's Equity Accounts Payable Accrued Expenses Total Current Liabilities Long-term Debt Total Liabilities Common Stock ($1.00 par) Additional Paid-in-Capital Retained Earnings Total Owner's Equity Total Liab. & Owner's Equity $35,200 $2,850 $38,050 $177,430 $215,480 $52,100 $121,500 $13,645 $187,245 $402,725 $32,700 $2,740 $35,440 $158,600 $194,040 $52,100 $121,500 $35,200 $208,800 $402,840 Analysis Z-Score Variables 2019 0.164x Bad 2020 ?!? ?!? X GOOD 0.88x 0.96x 0.869x NWC/TA RETA EBIT/TA BV or MV Equity/BV Liabilities Sales/TA GOOD OK OK OK X X z Score Bankruptcy Prediction (Yes/Maybe/No) 0.92x ??? 0.88x 1.697x ??? OK Clue: Z-score in 2019 was 1.697 Ratio 2020 2019 Industry 2020 Liquidity Ratios Current 2.44x 2.86% 2.70x Quick 1.51x 1.49x 1.00 Efficiency Ratios Inventory Tumover 9.89% 5.81x 7.00x A/R Tumover 9.00x 8.41x 10.70x Average Collection Period 39.98 days 42.81 days 33.64 days Fixed Asset Tumover 1.19x 1.17x 11.20x Total Asset Tumover 0.92% 0.88 2.60% Leverage Ratios Total Debt Ratio 53.51% 48.17% 50.00% Long-term Debt Ratio 44.06% 39.37% 20.00% LTD to Total Capitalization 48.65% 43.17% 28.57% Debt to Equity 1.15x 0.93x 1.00x LTD to Equity 94.76% 75.96% 40.00% Coverage Ratios Times Interest Earned -3.67x 3.06x 2.S0x Cash Coverage Ratio -0.18x 6.57x 2.80x Profitability Ratios Gross Profit Margin 6.22% 20.40% 17.50% Operating Profit Margin -7.63% 6.48% 6.25% Net Profit Margin -5.83% 2.62% 3.50% Return on Total Assets -5.35% 2.30% 9.10% Retum on Equity -11.51% 4.44% 18.20% Return on Common Equity -11.51% 4.44% 18.20% ROE (DuPont), 3-point -11.51% 4.44% 18.20% ROE (Extended DuPont), 5-point ??? 18.20% GOOD GOOD GOOD GOOD GOOD Bad Bad Bad Bad Bad Bad Bad Bad Bad #VALUE! Rocker Farms Income Statements For the Years 2019 and 2020 2020 Sales $370,000 Cost of Goods 347,000 Gross Profit 23,000 Depreciation 26,820 Selling & Admin. Expense 23,340 Other Operating Expense 1,080 Net Operating Income -28,240 Interest Expense 7,685 Earnings Before Taxes -35,925 Taxes -14,370 Net Income ($21,555) 2019 $354,000 281,800 72,200 26,360 21,820 1,080 22,940 7,505 15,435 6,174 $9,261 Notes: Tax Rate Shares Earnings per Share 40.00% 55,000 ($0.39) 40.00% 55,000 $0.17 2019 Rocker Farms Balance Sheet For the Year Ended December 31, 2020 2020 Assets Cash $14,714 Marketable Securities $1,841 Accounts Receivable $41,090 Inventory $35,100 Total Current Assets $92,745 Gross Fixed Assets $388,000 Accumulated Depreciation $78,020 Net Plant & Equipment $309,980 Total Assets $402,725 $10,300 $550 $42,100 $48,490 $101,440 $352,600 $51,200 $301,400 $402,840 Liabilities & Owner's Equity Accounts Payable Accrued Expenses Total Current Liabilities Long-term Debt Total Liabilities Common Stock ($1.00 par) Additional Paid-in-Capital Retained Earnings Total Owner's Equity Total Liab. & Owner's Equity $35,200 $2,850 $38,050 $177,430 $215,480 $52,100 $121,500 $13,645 $187,245 $402,725 $32,700 $2,740 $35,440 $158,600 $194,040 $52,100 $121,500 $35,200 $208,800 $402,840 Analysis Z-Score Variables 2019 0.164x Bad 2020 ?!? ?!? X GOOD 0.88x 0.96x 0.869x NWC/TA RETA EBIT/TA BV or MV Equity/BV Liabilities Sales/TA GOOD OK OK OK X X z Score Bankruptcy Prediction (Yes/Maybe/No) 0.92x ??? 0.88x 1.697x ??? OK Clue: Z-score in 2019 was 1.697 Ratio 2020 2019 Industry 2020 Liquidity Ratios Current 2.44x 2.86% 2.70x Quick 1.51x 1.49x 1.00 Efficiency Ratios Inventory Tumover 9.89% 5.81x 7.00x A/R Tumover 9.00x 8.41x 10.70x Average Collection Period 39.98 days 42.81 days 33.64 days Fixed Asset Tumover 1.19x 1.17x 11.20x Total Asset Tumover 0.92% 0.88 2.60% Leverage Ratios Total Debt Ratio 53.51% 48.17% 50.00% Long-term Debt Ratio 44.06% 39.37% 20.00% LTD to Total Capitalization 48.65% 43.17% 28.57% Debt to Equity 1.15x 0.93x 1.00x LTD to Equity 94.76% 75.96% 40.00% Coverage Ratios Times Interest Earned -3.67x 3.06x 2.S0x Cash Coverage Ratio -0.18x 6.57x 2.80x Profitability Ratios Gross Profit Margin 6.22% 20.40% 17.50% Operating Profit Margin -7.63% 6.48% 6.25% Net Profit Margin -5.83% 2.62% 3.50% Return on Total Assets -5.35% 2.30% 9.10% Retum on Equity -11.51% 4.44% 18.20% Return on Common Equity -11.51% 4.44% 18.20% ROE (DuPont), 3-point -11.51% 4.44% 18.20% ROE (Extended DuPont), 5-point ??? 18.20% GOOD GOOD GOOD GOOD GOOD Bad Bad Bad Bad Bad Bad Bad Bad Bad #VALUE
Step by Step Solution
There are 3 Steps involved in it

Get step-by-step solutions from verified subject matter experts