

Question: FIN 301 Financial Modeling Student Name: Current Perlod Worst Case Scenarios for Next Year Most Likely Case Best Case Assumptions Sales Growth COGS & Depreciation
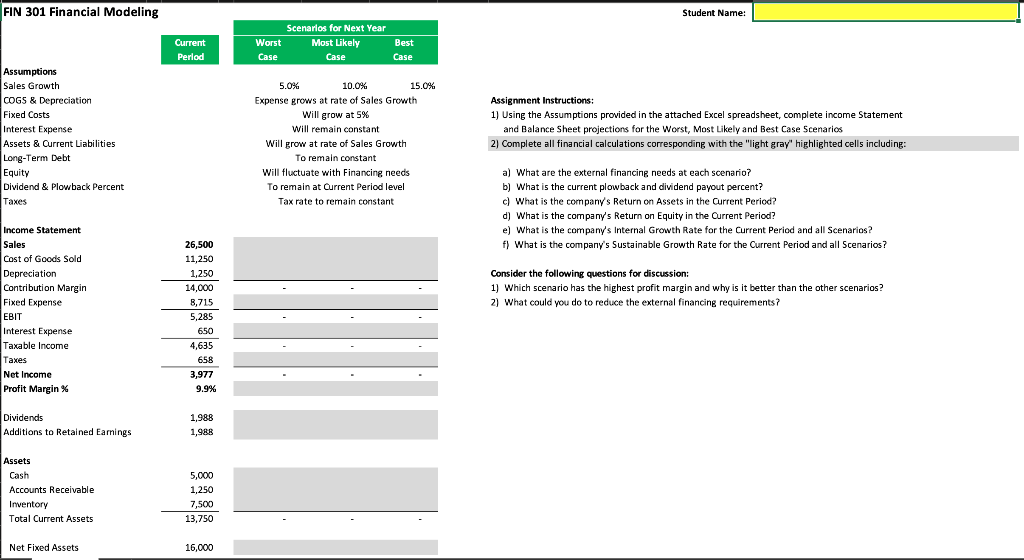
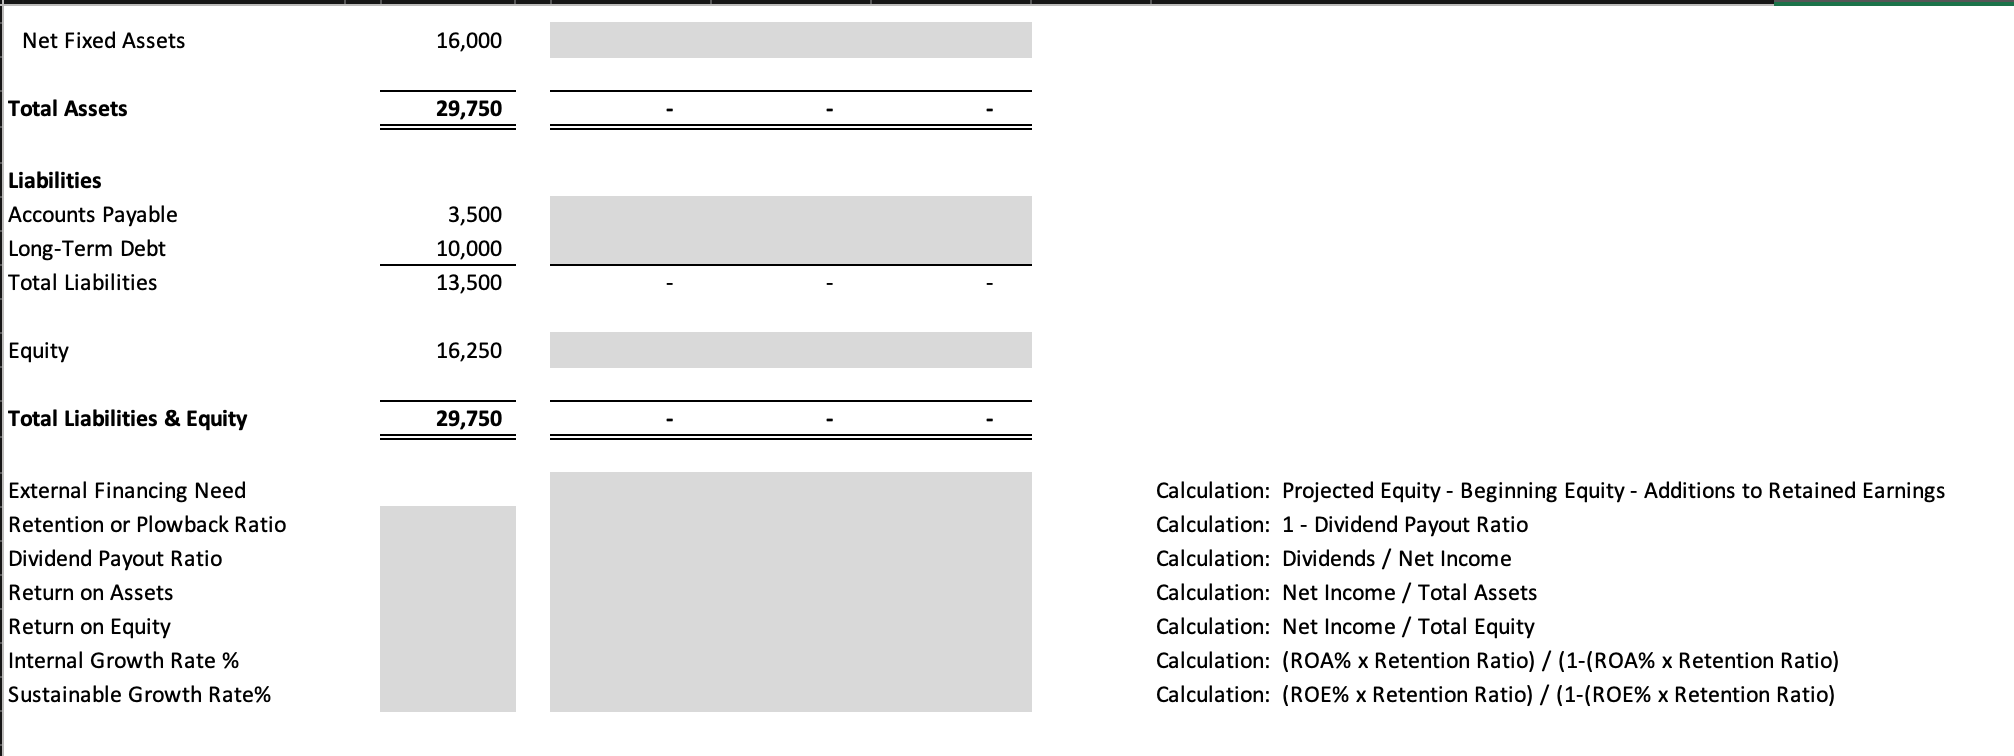
FIN 301 Financial Modeling Student Name: Current Perlod Worst Case Scenarios for Next Year Most Likely Case Best Case Assumptions Sales Growth COGS & Depreciation Fixed Costs Interest Expense Assets & Current Liabilities Long-Term Debt Equity Dividend & Plowback Percent 5.0% 10.0% 15.0% Expense grows at rate of Sales Growth Will grow at 5% will remain constant Will grow at rate of Sales Growth To remain constant Will fluctuate with Financing needs To remain at Current Period level Tax rate to remain constant Assignment Instructions: 1) Using the Assumptions provided in the attached Excel spreadsheet, complete income Statement and Balance Sheet projections for the Worst, Most Likely and Best Case Scenarios 2) Complete all financial calculations corresponding with the "light gray" highlighted cells including: Taxes a) What are the external financing needs at each scenario? b) What is the current plowback and dividend payout percent? c) What is the company's Return on Assets in the Current Period? d) What is the company's Return on Equity in the Current Period? e) What is the company's Internal Growth Rate for the Current Period and all Scenarios? f) What is the company's Sustainable Growth Rate for the Current Period and all Scenarios? Consider the following questions for discussion: 1) Which scenario has the highest profit margin and why is it better than the other scenarios? 2) What could you do to reduce the external financing requirements? Income Statement Sales Cost of Goods Sold Depreciation Contribution Margin Fixed Expense EBIT Interest Expense Taxable income Taxes Net Income Profit Margin % 26,500 11,250 1,250 14,000 8,715 5,285 650 4,635 658 3,977 9.9% Dividends Additions to Retained Earnings 1,988 1,988 5,000 Assets Cash Accounts Receivable Inventory Total Current Assets 1,250 7,500 13,750 Net Fixed Assets 16,000 Net Fixed Assets 16,000 Total Assets 29,750 Liabilities Accounts Payable Long-Term Debt Total Liabilities 3,500 10,000 13,500 Equity 16,250 Total Liabilities & Equity 29,750 External Financing Need Retention or Plowback Ratio Dividend Payout Ratio Return on Assets Return on Equity Internal Growth Rate % Sustainable Growth Rate% Calculation: Projected Equity - Beginning Equity - Additions to Retained Earnings Calculation: 1 - Dividend Payout Ratio Calculation: Dividends / Net Income Calculation: Net Income / Total Assets Calculation: Net Income / Total Equity Calculation: (ROA% x Retention Ratio) / (1-(ROA% x Retention Ratio) Calculation: (ROE% x Retention Ratio) / (1-(ROE% x Retention Ratio)
Step by Step Solution
There are 3 Steps involved in it

Get step-by-step solutions from verified subject matter experts