

Question: FIN 320 Final Project Milestone Two Guidelines and Rubric Overview Chipotle Mexican Grill Scenario The CFO of your company has asked for your support in
FIN 320 Final Project Milestone Two Guidelines and Rubric
Overview
Chipotle Mexican Grill
Scenario
The CFO of your company has asked for your support in preparing a report for the business's board of directors. Many of the board members are new, and some of them have little background in finance. With this in mind, you will need a report that all board members can easily understand.
Directions
Use the documents to calculate the same financial ratios. Finally, compare those ratios and analyze your results.
Specifically, you must address the following rubric criteria:
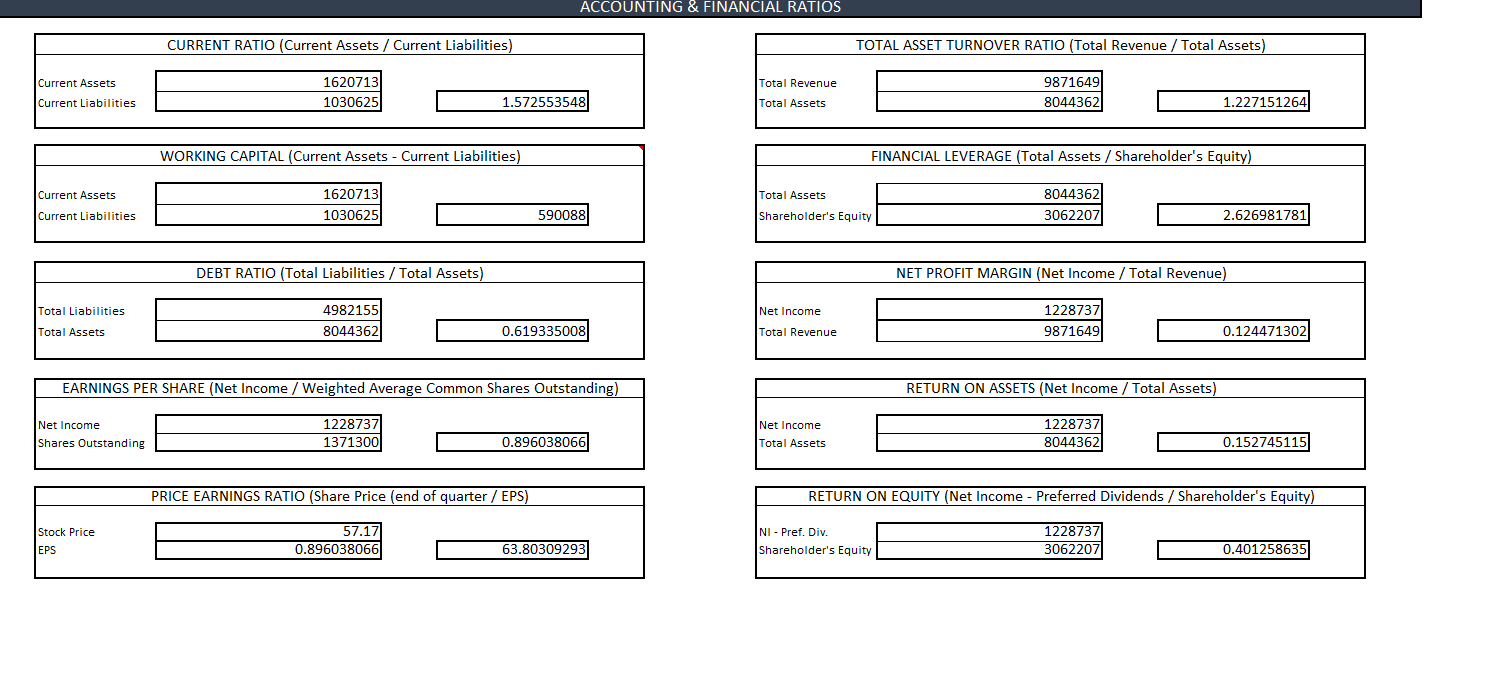
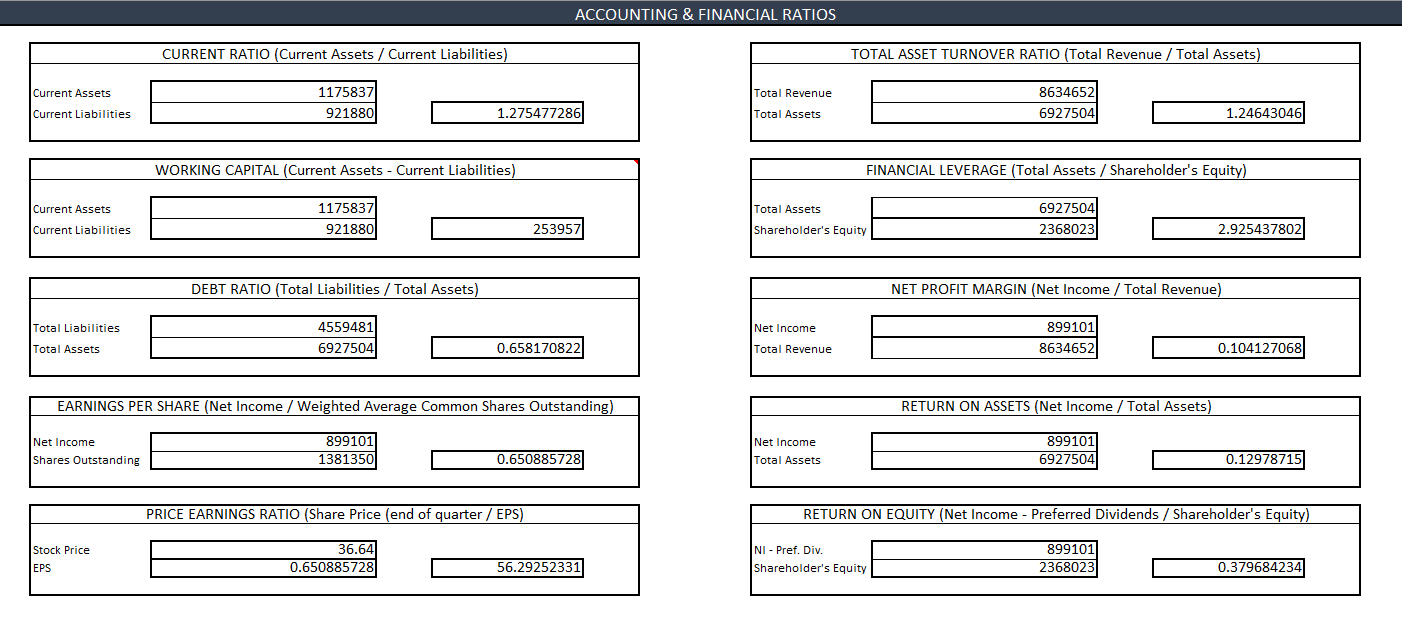
- Financial Calculations. Calculate accurate financial formulas to assess the business's current financial health. Specifically, calculate the following formulas using the Ratios Most Recent Fiscal Qtr and the Ratios Same Fiscal Qtr 1 Year Ago worksheets in the Final Project Financial Formulas workbook:
- Working capital
- Current ratio
- Debt ratio
- Earnings per share
- Price and earnings ratio
- Total asset turnover ratio
- Financial leverage
- Net profit margin
- Return on assets
- Return on equity
- Fiscal Quarter Comparison. Summarize the differences between the following:
- The results from your financial calculations of the most recent fiscal quarter
- The results of the same financial calculations of the same fiscal quarter from one year ago
- For example, if the most recent fiscal quarter available is the third quarter in 2023, you'll compare those results to the same financial calculations from the third quarter in 2022.
- Comparison Analysis. Explain what your calculations and comparison show about the business's current financial health. Give examples to support your explanation for the following questions:
- Do the results show the business is financially healthy or unhealthy? Which results indicate this?
- What might be the causes of the business's financial success or failure?
- Is more information needed to determine the business's financial health? If so, which pieces of information might still be needed?
- Short-Term Financing. Explain how potential short-term financing sources could help the business raise funds needed to improve its financial health. Base your response on the business's current financial information.
Ratios Most Recent Fiscal Qtr.
Step by Step Solution
There are 3 Steps involved in it
1 Expert Approved Answer
Step: 1 Unlock

Question Has Been Solved by an Expert!
Get step-by-step solutions from verified subject matter experts
Step: 2 Unlock
Step: 3 Unlock