

Question: FIN3310: INTERMEDIATE FINANCIAL ANALYSIS SPREADSHEET ASSIGNMENT Chapter 3 1. Read sections 3.5a through 3.5d in the textbook 2. Retrieve the file HWDataChapter3a. The data in
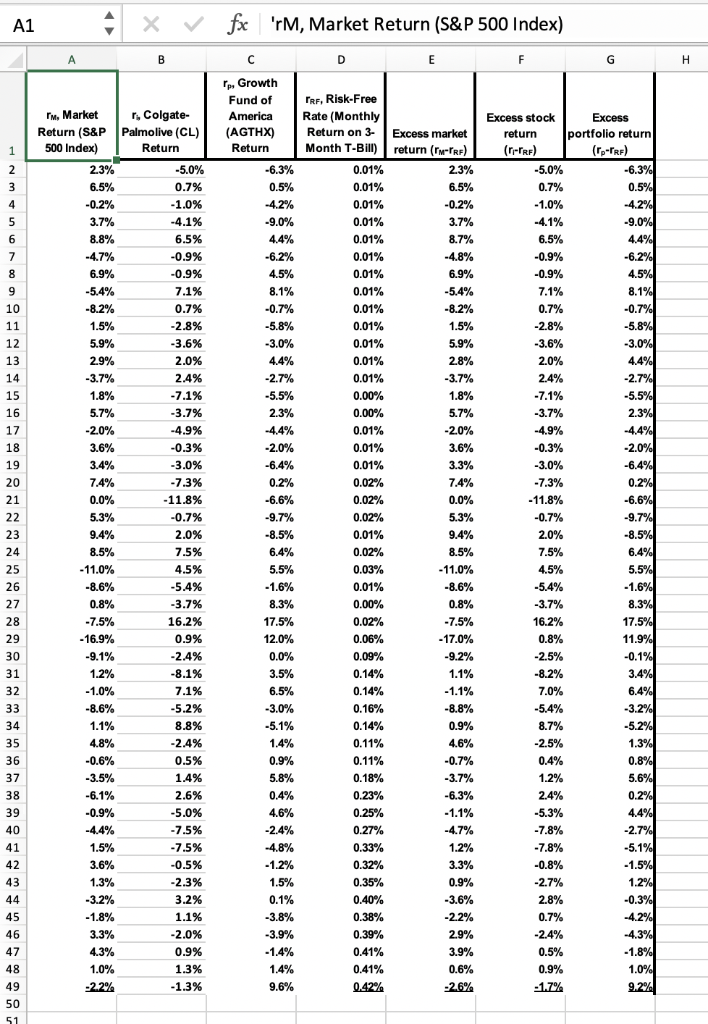
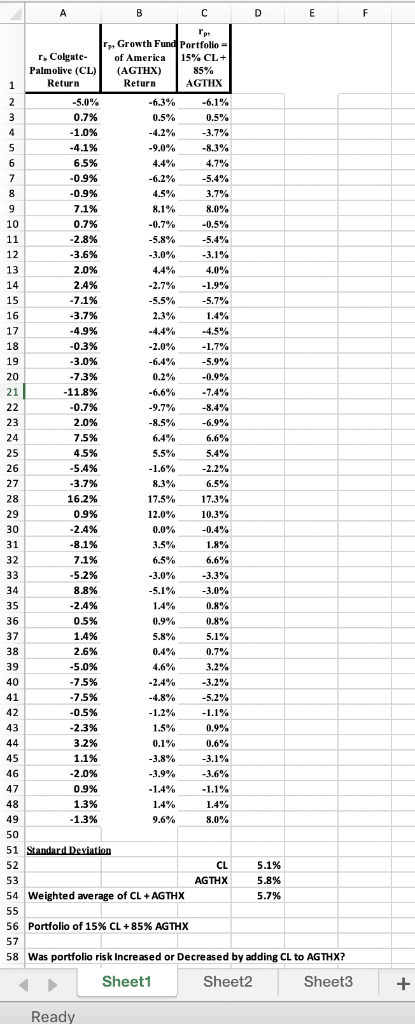
FIN3310: INTERMEDIATE FINANCIAL ANALYSIS SPREADSHEET ASSIGNMENT Chapter 3 1. Read sections 3.5a through 3.5d in the textbook 2. Retrieve the file HWDataChapter3a. The data in the file refer to a single stock (Colgate Palmolive), a broad measure of the stock market (Standard & Poor' s 500 Stock Index), a stock portfolio mutual fund (Growth Fund of America), and 3-month Treasury bills. All data begin in row 2 and end in row 49. 3. In Excel, select Data I Data Analysis| Regression. Click OK and enter the appropriate cell ranges for Colgate Palmolive Return and Market Return using the market model. These are the Input Y Range and Input X Range, respectively. Important note: The Analysis Toolpak is required for regression analysis in Excel 4. Change the column width to 12 for each column of Summary Output. Print using a landscape orientation 5. In Excel, select Data l Data Analysis | Regression. Click OK and enter the appropriate cell ranges for Colgate Palmolive Return and Market Return using the CAPM: Excess returns model (subtracts rRF from both the stock returns and market returns) These are the Input Y Range and Input X Range, respectively (Reminder: The original columns of data are available in Sheet 6. Change the column width to 12 for each column of Summary Output. Print using a landscape orientation. (Note: The results for parts 4 and 6 should be similar.) 7. In Excel, select Data | Data Analysis l Regression. Click OK and enter the appropriate cell ranges for Growth Fund of America Return and Market Return using the market model. These are the Input Y Range and Input X Range, respectively 8. Change the column width to 12 for each column of Summary Output. Print using a landscape orientation 9. In Excel, select Data | Data Analysis Regression. Click OK and enter the appropriate cell ranges for Growth Fund of America Return and Market Return using the CAPM: Excess returns Model (subtracts rRr from both the mutual fund portfolio returns and Market returns). These are the Input Y Range and Input x Range, respectively. 10. Change the column width to 12 for each column of Summary Output.Print using a landscape orientation. (Note: The results for parts 8 and 10 should be similar.) 11. Retrieve the file HWDataChapter3a+. Stand-alone standard deviations of CL and AGTHX are computed in Cell D52 and Cell D53, respectively. Suppose a portfolio is created by investing 15% in CL and 85% in AGTHX . The weighted average standard deviation is calculated in Cell D54. Column C computes rates of return for this portfolio. Calculate the standard deviation of this portfolio in Cell D56 and enter either increased or Decreased in Cell H58 fx 'rM, Market Return (S&P 500 Index) rp, Growth TRF, Risk-Free Rate (Monthly Return on 3 Excess market Month T-Bil)return (rM-TRF) rM, Market r, Colgate- America Return (S&P Palmolive (CL)(AGTHX Return Excess stock return (r-TRF) portfolio return (rp-TRF) 500 Index) Return 0.01% 0.01% 0.01% 0.01% 0.01% 0.01% 0.01% 0.01% 0.01% 0.01% 0.01% 0.01% 0.01% 1.0% 6.5% -0.9% -0.9% 7.1% 6.5% -0.9% 1.5% 5.9% 29% 3.6% 2.0% 2.4% 1.5% 5.9% 2.8% -30% -3.6% 2. 5. 1.8% 1.8% 0.00% 0.01% 0.01% 0.01% 0.02% 0.02% 0.02% 0.01% 0.02% 0.03% 0.01% 0.00% 0.02% -4.9% -20% 3.6% -4.9% -0.3% -20% 38% 2. 7.3% -11.8% 0.2% 74% -11.8% 2.0% 7.5% 4.5% 20% -11.0% -8.6% -11.0% 45% 5. 8.3% 17.5% 12.0% 0.0% -75% 16.2% 0.9% 2.4% -75% 16.2% 0.09% 0.14% 1.2% 7.1% 5.2% 8.8% -8.6% -30% 0.16% 0.9% 45% 0.11% 0.11% -0.6% 0.5% 2.6% 5.0% 7.5% 7.5% -0.5% 2.3% 3.2% 1.1% 2.0% 0.9% 1.3% 0.23% 0.25% 0.27% 0.33% 0.32% 0.35% 0.40% 0.38% 0.39% 0.41% 0.4% -0.9% -4.4% 1.5% 2. 7.8% -0.8% 1.2% 0.9% 3 % -18% -3.8% 28% 3.9% rGrowth Fund Portfolio- r* Colgate- ofAmerica Palmolive (CL)(AGTHX) 15% CL 85% AGTHX Return Return -5.0% 0.7% 1.096 -6.3% 0.5% -4.2% 9.0% 4.4% -6.2% 0.5% 3.7% -8.3% 4.7% -5.4% 3.7% 6.5% 0.9% -0.9% 7.1% 0.7% 2.8% 3.6% -0,5% -5.4% 3.0% 4.4% 2.7% 2.4% 7.1% 3.7% -4.9% -0.3% 3.0% 7.3% 11.8% .9% 2.3% -4.4% 2.0% -6.4% 0.2% -6.6% 1.4% 1.7% -5.9% -0.9% 7.4% -8.4% -6.9% 7.5% 4.5% 5.4% 6.4% 55% 1.6% 8.3% 17.5% 12.0% 5.4% 16.2% 0.9% 2.4% 17.3% 10.3% -0.4% 1.8% 6.6% -33 % 3.0% 0.8% 0.8% 5.1% 0.7% 7.1% 5.2% 8.8% 3.5% 6.5% 3.0% 1.4% 0.9% 0.5% 1.4% 2.6% 5.0% 7.5% 7.5% -0.5% 2.3% 3.2% 1.1% 0.4% 4.6% 2.4% -3.2% -5.2% 1.2% 1.5% 0.9% 0.9% 1.3% 1.3% 3.8% 3.9% 1.4% 1.4% 96% 1.4% CL AGTHX 5.1% 5.8% 54 Weighted average of CL AGTHX 56 Portfolio of 15% CL +85% AGTHX 58 Was portfolio risk Increased or Decreased by adding CL to AGTHX? Sheet Sheet2 Ready FIN3310: INTERMEDIATE FINANCIAL ANALYSIS SPREADSHEET ASSIGNMENT Chapter 3 1. Read sections 3.5a through 3.5d in the textbook 2. Retrieve the file HWDataChapter3a. The data in the file refer to a single stock (Colgate Palmolive), a broad measure of the stock market (Standard & Poor' s 500 Stock Index), a stock portfolio mutual fund (Growth Fund of America), and 3-month Treasury bills. All data begin in row 2 and end in row 49. 3. In Excel, select Data I Data Analysis| Regression. Click OK and enter the appropriate cell ranges for Colgate Palmolive Return and Market Return using the market model. These are the Input Y Range and Input X Range, respectively. Important note: The Analysis Toolpak is required for regression analysis in Excel 4. Change the column width to 12 for each column of Summary Output. Print using a landscape orientation 5. In Excel, select Data l Data Analysis | Regression. Click OK and enter the appropriate cell ranges for Colgate Palmolive Return and Market Return using the CAPM: Excess returns model (subtracts rRF from both the stock returns and market returns) These are the Input Y Range and Input X Range, respectively (Reminder: The original columns of data are available in Sheet 6. Change the column width to 12 for each column of Summary Output. Print using a landscape orientation. (Note: The results for parts 4 and 6 should be similar.) 7. In Excel, select Data | Data Analysis l Regression. Click OK and enter the appropriate cell ranges for Growth Fund of America Return and Market Return using the market model. These are the Input Y Range and Input X Range, respectively 8. Change the column width to 12 for each column of Summary Output. Print using a landscape orientation 9. In Excel, select Data | Data Analysis Regression. Click OK and enter the appropriate cell ranges for Growth Fund of America Return and Market Return using the CAPM: Excess returns Model (subtracts rRr from both the mutual fund portfolio returns and Market returns). These are the Input Y Range and Input x Range, respectively. 10. Change the column width to 12 for each column of Summary Output.Print using a landscape orientation. (Note: The results for parts 8 and 10 should be similar.) 11. Retrieve the file HWDataChapter3a+. Stand-alone standard deviations of CL and AGTHX are computed in Cell D52 and Cell D53, respectively. Suppose a portfolio is created by investing 15% in CL and 85% in AGTHX . The weighted average standard deviation is calculated in Cell D54. Column C computes rates of return for this portfolio. Calculate the standard deviation of this portfolio in Cell D56 and enter either increased or Decreased in Cell H58 fx 'rM, Market Return (S&P 500 Index) rp, Growth TRF, Risk-Free Rate (Monthly Return on 3 Excess market Month T-Bil)return (rM-TRF) rM, Market r, Colgate- America Return (S&P Palmolive (CL)(AGTHX Return Excess stock return (r-TRF) portfolio return (rp-TRF) 500 Index) Return 0.01% 0.01% 0.01% 0.01% 0.01% 0.01% 0.01% 0.01% 0.01% 0.01% 0.01% 0.01% 0.01% 1.0% 6.5% -0.9% -0.9% 7.1% 6.5% -0.9% 1.5% 5.9% 29% 3.6% 2.0% 2.4% 1.5% 5.9% 2.8% -30% -3.6% 2. 5. 1.8% 1.8% 0.00% 0.01% 0.01% 0.01% 0.02% 0.02% 0.02% 0.01% 0.02% 0.03% 0.01% 0.00% 0.02% -4.9% -20% 3.6% -4.9% -0.3% -20% 38% 2. 7.3% -11.8% 0.2% 74% -11.8% 2.0% 7.5% 4.5% 20% -11.0% -8.6% -11.0% 45% 5. 8.3% 17.5% 12.0% 0.0% -75% 16.2% 0.9% 2.4% -75% 16.2% 0.09% 0.14% 1.2% 7.1% 5.2% 8.8% -8.6% -30% 0.16% 0.9% 45% 0.11% 0.11% -0.6% 0.5% 2.6% 5.0% 7.5% 7.5% -0.5% 2.3% 3.2% 1.1% 2.0% 0.9% 1.3% 0.23% 0.25% 0.27% 0.33% 0.32% 0.35% 0.40% 0.38% 0.39% 0.41% 0.4% -0.9% -4.4% 1.5% 2. 7.8% -0.8% 1.2% 0.9% 3 % -18% -3.8% 28% 3.9% rGrowth Fund Portfolio- r* Colgate- ofAmerica Palmolive (CL)(AGTHX) 15% CL 85% AGTHX Return Return -5.0% 0.7% 1.096 -6.3% 0.5% -4.2% 9.0% 4.4% -6.2% 0.5% 3.7% -8.3% 4.7% -5.4% 3.7% 6.5% 0.9% -0.9% 7.1% 0.7% 2.8% 3.6% -0,5% -5.4% 3.0% 4.4% 2.7% 2.4% 7.1% 3.7% -4.9% -0.3% 3.0% 7.3% 11.8% .9% 2.3% -4.4% 2.0% -6.4% 0.2% -6.6% 1.4% 1.7% -5.9% -0.9% 7.4% -8.4% -6.9% 7.5% 4.5% 5.4% 6.4% 55% 1.6% 8.3% 17.5% 12.0% 5.4% 16.2% 0.9% 2.4% 17.3% 10.3% -0.4% 1.8% 6.6% -33 % 3.0% 0.8% 0.8% 5.1% 0.7% 7.1% 5.2% 8.8% 3.5% 6.5% 3.0% 1.4% 0.9% 0.5% 1.4% 2.6% 5.0% 7.5% 7.5% -0.5% 2.3% 3.2% 1.1% 0.4% 4.6% 2.4% -3.2% -5.2% 1.2% 1.5% 0.9% 0.9% 1.3% 1.3% 3.8% 3.9% 1.4% 1.4% 96% 1.4% CL AGTHX 5.1% 5.8% 54 Weighted average of CL AGTHX 56 Portfolio of 15% CL +85% AGTHX 58 Was portfolio risk Increased or Decreased by adding CL to AGTHX? Sheet Sheet2 Ready
Step by Step Solution
There are 3 Steps involved in it

Get step-by-step solutions from verified subject matter experts