

Question: FINA 3600 Minicase 2: Put options on USD Objective: Analyze the profit/loss and break-even point for a currency put option Due date: November 23, 11:59
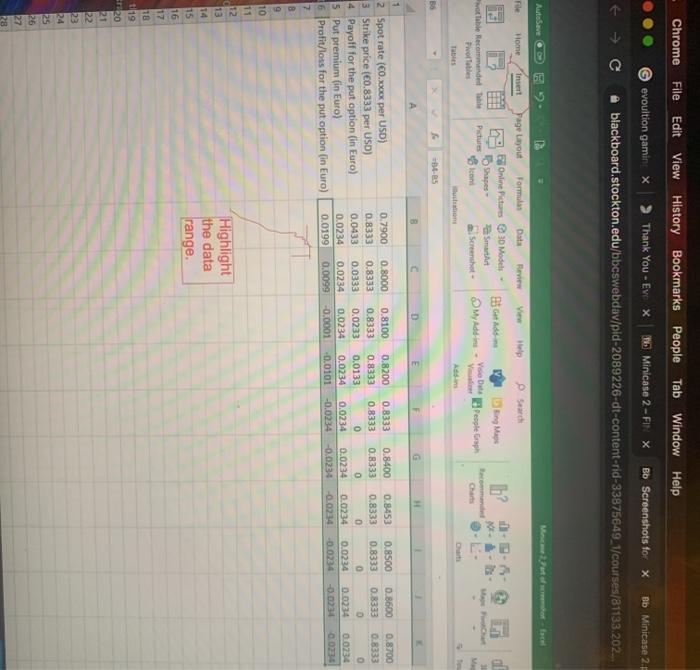
FINA 3600 Minicase 2: Put options on USD Objective: Analyze the profit/loss and break-even point for a currency put option Due date: November 23, 11:59 pm This minicase weighs 5% of your overall grade Requirements: A speculator is considering the purchase of one three-month put option on USD with an exercise price of 0.8333 euro per USD. The premium is 0.0234 euro. The current spot price is 0.8493 euro per USD and the 90-day forward rate is 0.8453 euro per USD. The speculator believes the U.S. dollar will depreciate against the Euro to 0.8000 euro per USD over the next three months. As the speculator's assistant, you have been asked to prepare the followings: 1. Graph the profit/loss diagram of the put option in an Excel spreadsheet. 2. Determine the speculator's profit if the USD depreciates to 0.8000 euro per USD. 3. Determine the speculator's profit/loss if the USD depreciates only to the forward rate. 4. Determine the future spot price at which the speculator will only break even To draw the profit/loss diagram de a put option for Part 1, you will create a few rows with these headers: spot rate (CO.xxxx per USD), exercise price (60.8333 per USD), payoff for the put option, put premium (C0.0234), and profit/loss for the put option in Excel. After creating these headers, you will also create a few spot rates below and above the exercise price (0.8333 per USD): To calculate the payoff for the put option in Excel, you can use the max function: -max(Exercise price - Spot rate, 0). The profit/loss for the long put is to subtract the put premium from the payoffs. Then highlighting the data points of profit/loss in the spreadsheet and choosing 2-D Line from Insert tab, you will create the profit/loss diagram for the put option. Certainly, you will format data points on the horizontal axis to the corresponding spot rates. To do this, right click on horizontal axis, choose "Select data", and edit horizontal axis labels. The currency unit on the vertical and horizontal axes is the Euro. You should also add a chart title For Parts 2 to 3, please show your calculations in Excel, which can be done in Part 1 if you have included these values in the spot rate. Please review chapter 7 powerpoint slides 19 and 20 and page 4 of supplemental class notes if you do not know how to compute the break even rate. Please submit your Excel file before or by the due date on Blackboard. Chrome File Edit View History Bookmarks People Tab Window Help evoultion gaminx > Thank You - Ew x blackboard.stockton.edu/bbcswebdav/pld-2089226-dt-content-rid-33875649_1/courses/81133 202... 16 Minicase 2-FX Bb Screenshots for X Bb Minicase 2 Auto save Marof - View Seardi Home Page Layout Formulas Raw E Online Pictures 3D Models Shapes SmartArt vorable Recommended the Pictures Photos Icon Screenshot b? Bot Get My Add-ins Maps People Graph NE Vse Date V Tables B5 A B c D 0.8500 0.8333 0.8700 0.8333 0.7900 0.8333 0.0433 0.0234 0.0199 0.8000 0.8333 0.0333 0.0234 0.0099 0.8100 0.8333 0.0233 0,0234 -0.0001 0.8200 0.8333 0.0133 0.0234 -0.0101 0.8333 0.8333 0 0.0234 -0.0234 0.8400 0.8333 0 0.0234 -0.0234 0.8453 0.8333 0 0.0234 -0.0234 0.8600 0.8333 0 0.0234 0.0234 -0.0234 0.0234 D D 1 2 Spot rate (0.xxx per USD) 3 Strike price (0.8333 per USD) 4 Payoff for the put option in Euro) 5 Put premium (in Euro) 6 Profit/loss for the put option (in Euro) 7 8 9 10 11 12 13 14 15 16 17 18 Highlight the data range. 119 Sr20 21 22 23 25 26 27 28 FINA 3600 Minicase 2: Put options on USD Objective: Analyze the profit/loss and break-even point for a currency put option Due date: November 23, 11:59 pm This minicase weighs 5% of your overall grade Requirements: A speculator is considering the purchase of one three-month put option on USD with an exercise price of 0.8333 euro per USD. The premium is 0.0234 euro. The current spot price is 0.8493 euro per USD and the 90-day forward rate is 0.8453 euro per USD. The speculator believes the U.S. dollar will depreciate against the Euro to 0.8000 euro per USD over the next three months. As the speculator's assistant, you have been asked to prepare the followings: 1. Graph the profit/loss diagram of the put option in an Excel spreadsheet. 2. Determine the speculator's profit if the USD depreciates to 0.8000 euro per USD. 3. Determine the speculator's profit/loss if the USD depreciates only to the forward rate. 4. Determine the future spot price at which the speculator will only break even To draw the profit/loss diagram de a put option for Part 1, you will create a few rows with these headers: spot rate (CO.xxxx per USD), exercise price (60.8333 per USD), payoff for the put option, put premium (C0.0234), and profit/loss for the put option in Excel. After creating these headers, you will also create a few spot rates below and above the exercise price (0.8333 per USD): To calculate the payoff for the put option in Excel, you can use the max function: -max(Exercise price - Spot rate, 0). The profit/loss for the long put is to subtract the put premium from the payoffs. Then highlighting the data points of profit/loss in the spreadsheet and choosing 2-D Line from Insert tab, you will create the profit/loss diagram for the put option. Certainly, you will format data points on the horizontal axis to the corresponding spot rates. To do this, right click on horizontal axis, choose "Select data", and edit horizontal axis labels. The currency unit on the vertical and horizontal axes is the Euro. You should also add a chart title For Parts 2 to 3, please show your calculations in Excel, which can be done in Part 1 if you have included these values in the spot rate. Please review chapter 7 powerpoint slides 19 and 20 and page 4 of supplemental class notes if you do not know how to compute the break even rate. Please submit your Excel file before or by the due date on Blackboard. Chrome File Edit View History Bookmarks People Tab Window Help evoultion gaminx > Thank You - Ew x blackboard.stockton.edu/bbcswebdav/pld-2089226-dt-content-rid-33875649_1/courses/81133 202... 16 Minicase 2-FX Bb Screenshots for X Bb Minicase 2 Auto save Marof - View Seardi Home Page Layout Formulas Raw E Online Pictures 3D Models Shapes SmartArt vorable Recommended the Pictures Photos Icon Screenshot b? Bot Get My Add-ins Maps People Graph NE Vse Date V Tables B5 A B c D 0.8500 0.8333 0.8700 0.8333 0.7900 0.8333 0.0433 0.0234 0.0199 0.8000 0.8333 0.0333 0.0234 0.0099 0.8100 0.8333 0.0233 0,0234 -0.0001 0.8200 0.8333 0.0133 0.0234 -0.0101 0.8333 0.8333 0 0.0234 -0.0234 0.8400 0.8333 0 0.0234 -0.0234 0.8453 0.8333 0 0.0234 -0.0234 0.8600 0.8333 0 0.0234 0.0234 -0.0234 0.0234 D D 1 2 Spot rate (0.xxx per USD) 3 Strike price (0.8333 per USD) 4 Payoff for the put option in Euro) 5 Put premium (in Euro) 6 Profit/loss for the put option (in Euro) 7 8 9 10 11 12 13 14 15 16 17 18 Highlight the data range. 119 Sr20 21 22 23 25 26 27 28
Step by Step Solution
There are 3 Steps involved in it

Get step-by-step solutions from verified subject matter experts