

Question: FINA310 UNIT 2 Assignment Details The Price is Right! Utilizing Wal-Mart, determine the right price for that companys stock in the following 3 easy steps:
FINA310
UNIT 2
Assignment Details
The Price is Right! Utilizing Wal-Mart, determine the right price for that companys stock in the following 3 easy steps:
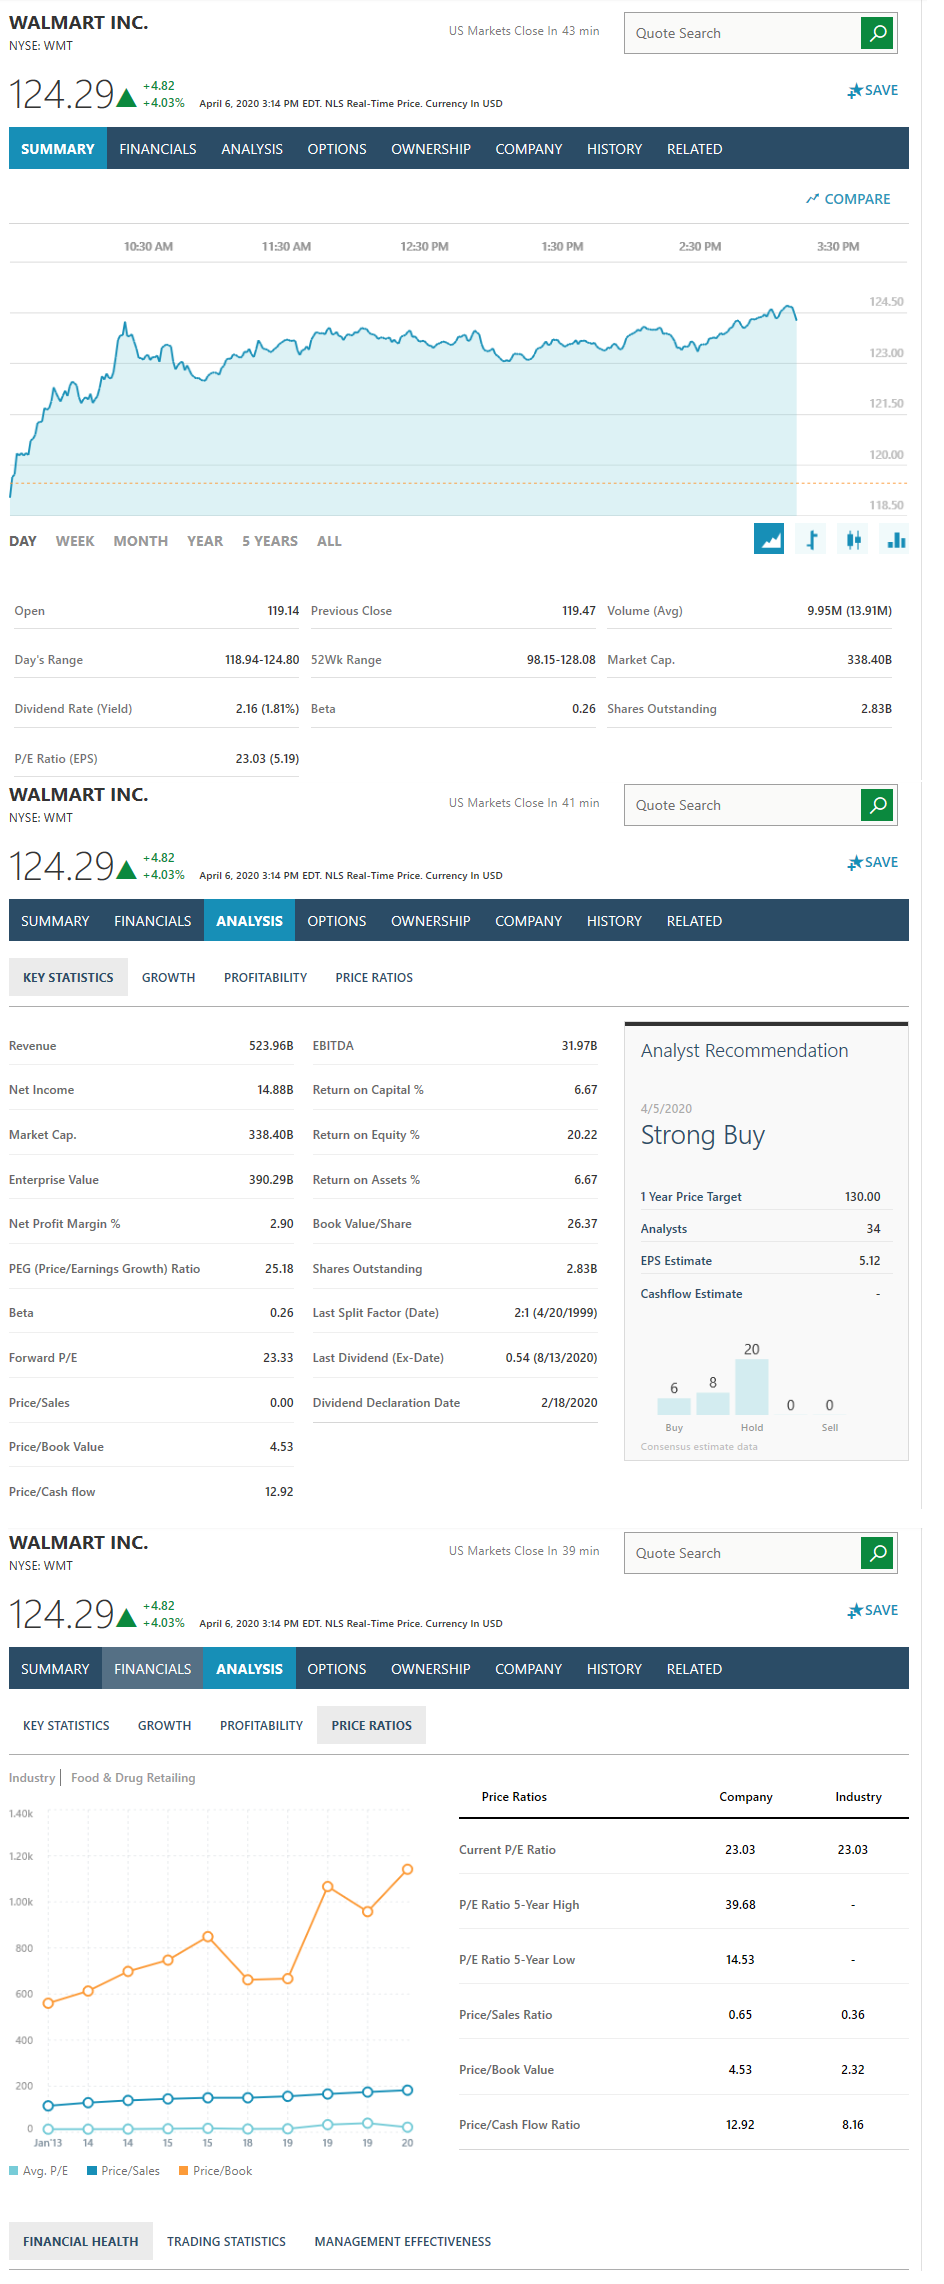
- Select the Analysis tab, and find the Analyst Recommendation box. Jot down the stocks Earnings Per Share (EPS) Estimate.
- Select the Price Ratios tab, and jot down the current Price to Earnings Ratio (P/E) for the industry (not the company).
- Using the PE valuation model to determine the right price for this stock, multiply the industry average P/E ratio by the stocks EPS to estimate the intrinsic price of the stock.
Answer the following questions:
- Is this stock overvalued or undervalued when compared to the current stock price?
- What are the analysts recommendations for this stock (buy, sell, or hold)?
- Do you agree with them? Would you consider purchasing this stock? Why?
WALMART INC. NYSE: WMT US Markets Close In 43 min Quote Search #SAVE 7.29 +4.82 +4.03% April 6, 2020 3:14 PM EDT. NLS Real-Time Price. Currency In USD SUMMARY FINANCIALS ANALYSIS OPTIONS OWNERSHIP COMPANY HISTORY RELATED RELATED COMPARE 10:30 AM 11:30 AM 12:30 PM 1:30 PM 2:30 PM 3:30 PM 124.50 ummon 123.00 121.50 120.00 118.50 DAY WEEK MONTH YEAR 5 YEARS ALL Open 119.14 Previous Close 119.47 Volume (Avg) 9.95M (13.91M) Day's Range 118.94-124.80 52Wk Range 98.15-128.08 Market Cap. 338.40B Dividend Rate (Yield) 2.16 (1.81%) Beta 0.26 Shares Outstanding 2.83B P/E Ratio (EPS) 23.03 (5.19) WALMART INC. NYSE: WMT US Markets Close In 41 min Quote Search 12120 +4.82 +4.03% #SAVE April 6, 2020 3:14 PM EDT. NLS Real-Time Price. Currency In USD SUMMARY FINANCIALS ANALYSIS OPTIONS OWNERSHIP COMPANY HISTORY RELATED KEY STATISTICS GROWTH PROFITABILITY PRICE RATIOS Revenue 523.96B EBITDA 31.97B Analyst Recommendation Net Income 14.88B Return on Capital % 6.67 4/5/2020 Strong Buy Market Cap. 338.40B Return on Equity % 20.22 Enterprise Value 390.29B Return on Assets % 6.67 1 Year Price Target 130.00 Net Profit Margin % 2.90 Book Value/Share 26.37 Analysts EPS Estimate PEG (Price/Earnings Growth) Ratio 25.18 Shares Outstanding 2.83B Cashflow Estimate Beta 0.26 Last Split Factor (Date) 2:1 (4/20/1999) Forward P/E 23.33 20 Last Dividend (Ex-Date) 0.54 (8/13/2020) 6 8 Price/Sales 0.00 Dividend Declaration Date 2/18/2020 0 0 Sell Buy Hold Consensus estimate data Price/Book Value 4.53 Price/Cash flow 12.92 WALMART INC. NYSE: WMT US Markets Close In 39 min Quote Search 12429 +4.82 *SAVE +4.03% April 6, 2020 3:14 PM EDT. NLS Real-Time Price. Currency In USD SUMMARY FINANCIALS ANALYSIS OPTIONS OWNERSHIP COMPANY HISTORY RELATED KEY STATISTICS GROWTH PROFITABILITY PRICE RATIOS Industry Food & Drug Retailing Price Ratios Company Industry 1.40k Current P/E Ratio 23.03 23.03 1.20k 1.00K P/E Ratio 5-Year High 39.68 P/E Ratio 5-Year Low 14.53 Price/Sales Ratio 0.65 0.36 Price/Book Value 4.53 2.32 Price/Cash Flow Ratio 12.92 8.16 14 19 19 1920 Jan'13 Avg. P/E 14 15 Price/Sales 15 18 Price/Book FINANCIAL HEALTH TRADING STATISTICS MANAGEMENT EFFECTIVENESS
Step by Step Solution
There are 3 Steps involved in it

Get step-by-step solutions from verified subject matter experts