

Question: Final Exam X Course Hero * + X C & https://egcc.instructure.com/courses/19587/assignments/489739 Not syncing .. . People Question 31 > 0/1 pt 9 2 8 Details
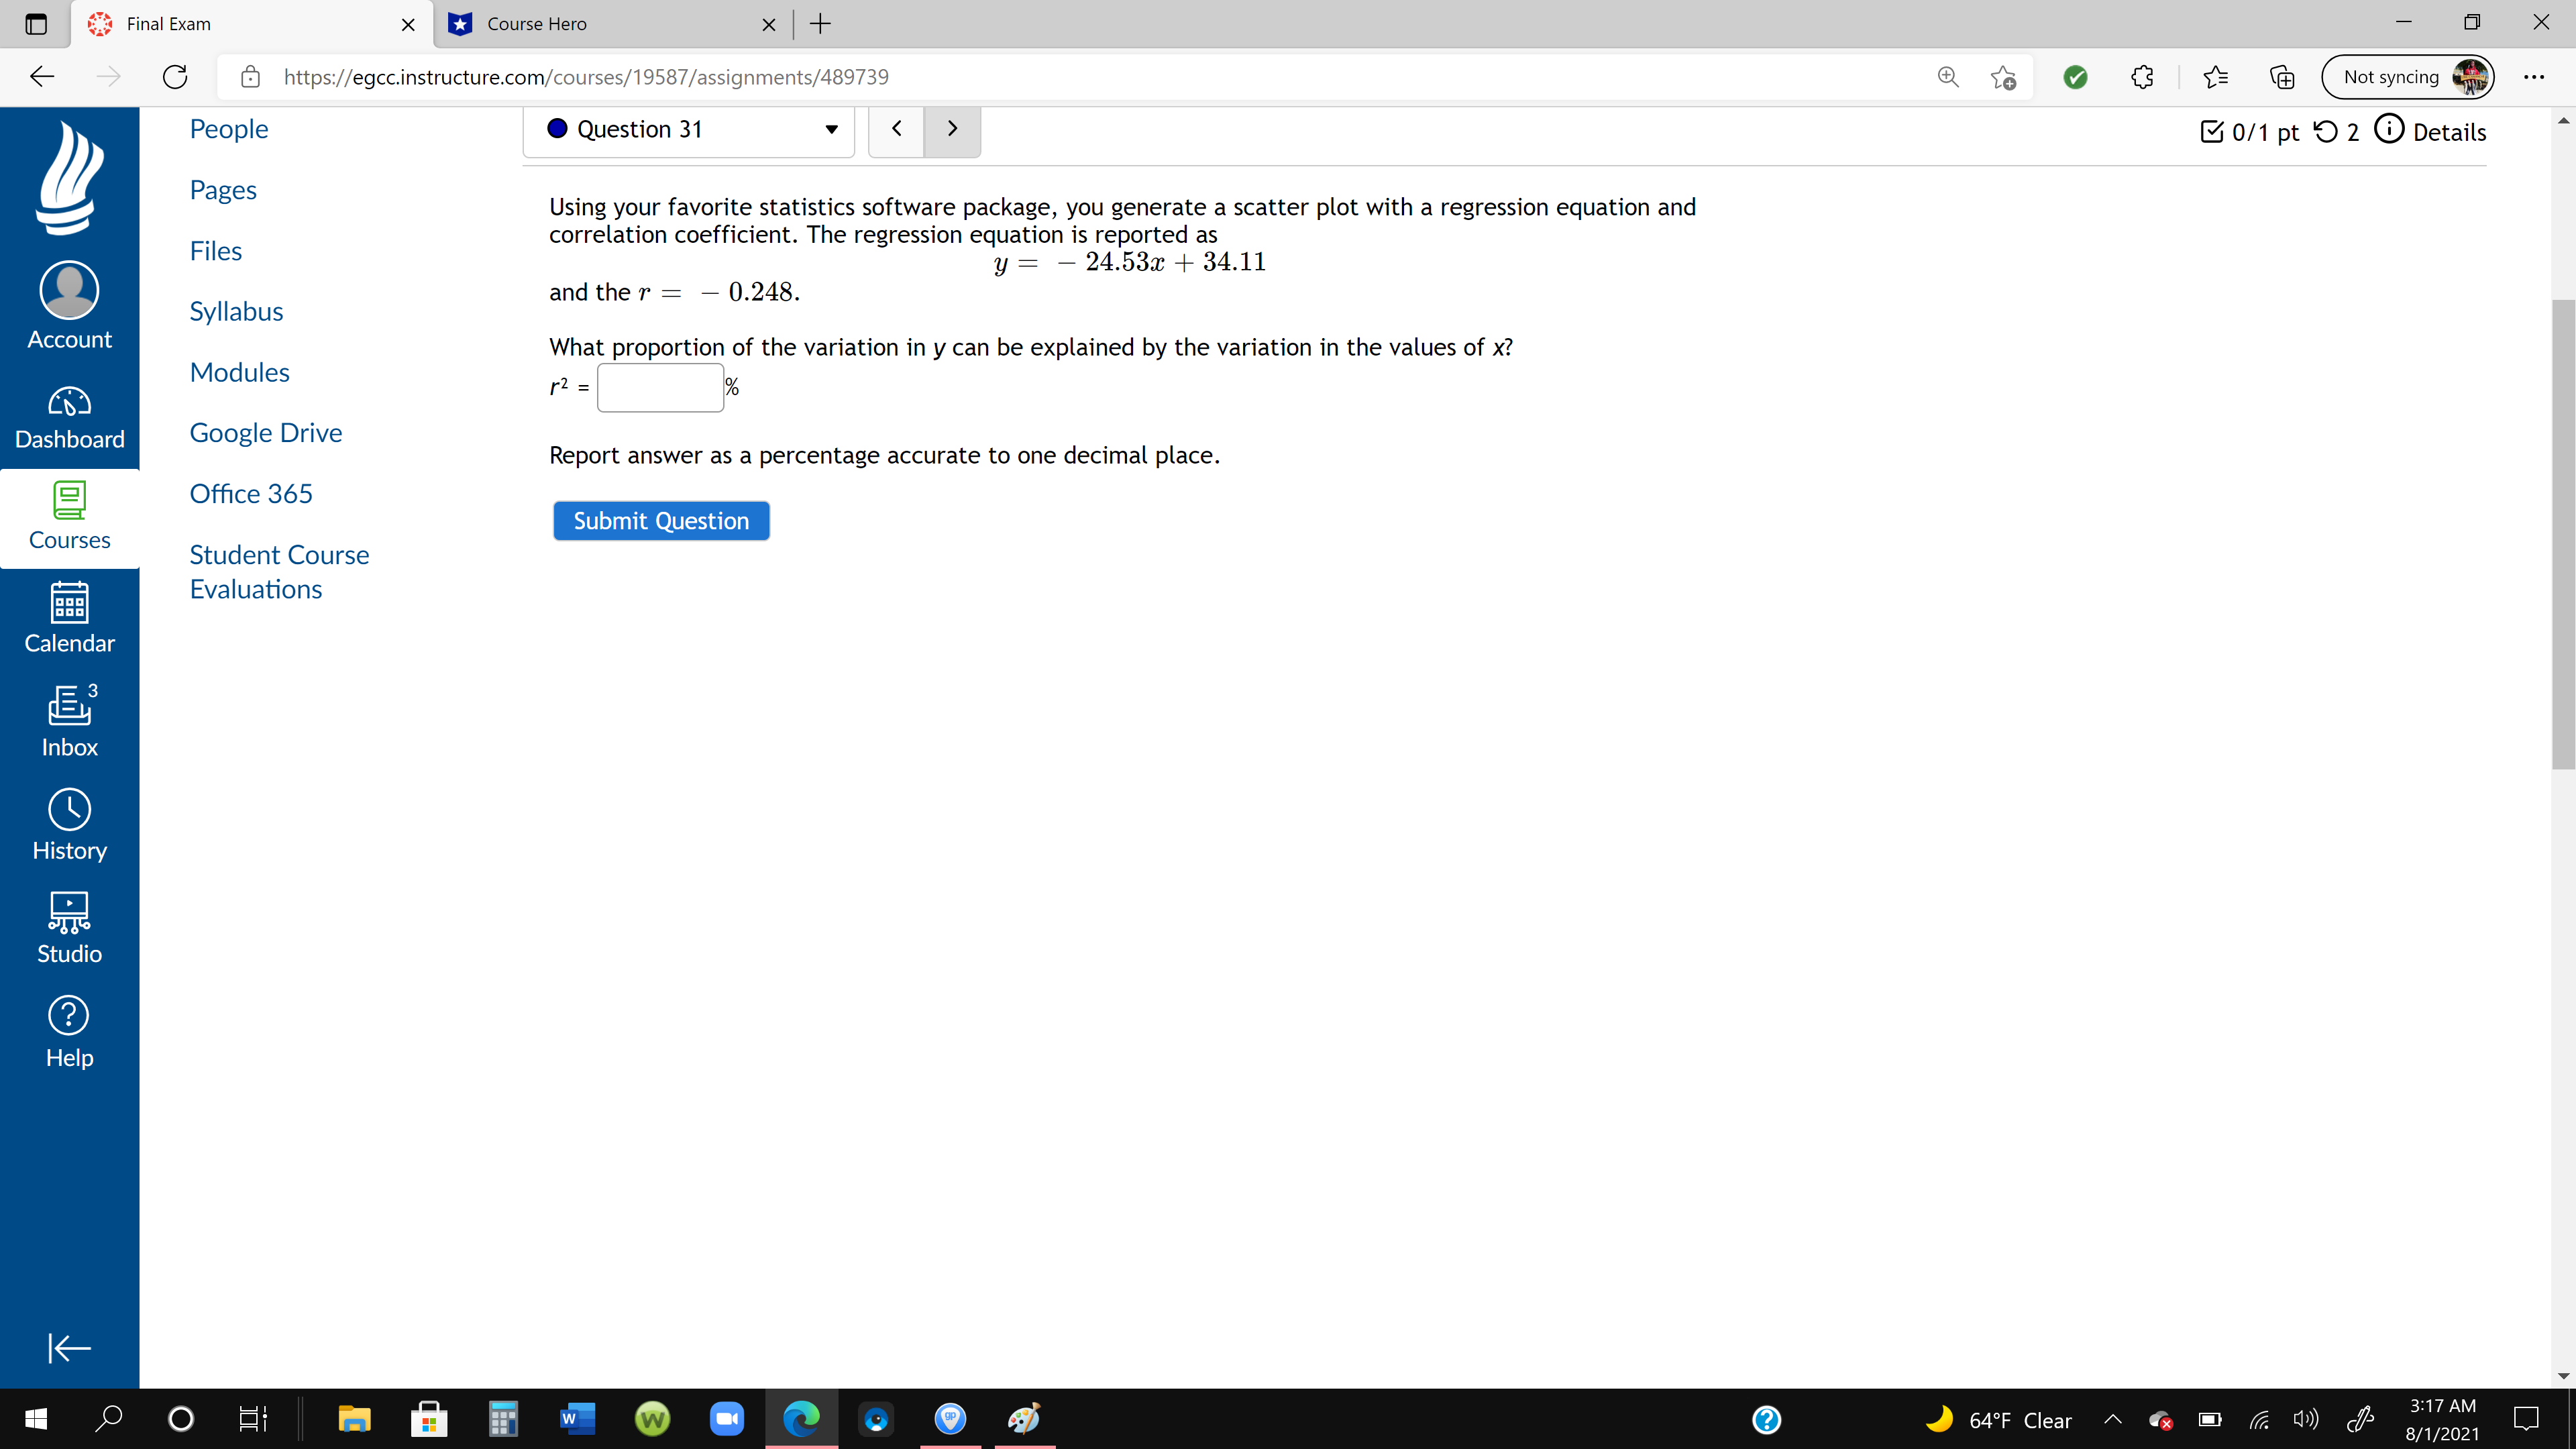
Final Exam X Course Hero * + X C & https://egcc.instructure.com/courses/19587/assignments/489739 Not syncing .. . People Question 31 > 0/1 pt 9 2 8 Details Pages Using your favorite statistics software package, you generate a scatter plot with a regression equation and Files correlation coefficient. The regression equation is reported as y = - 24.53x + 34.11 and the r = - 0.248. Syllabus Account What proportion of the variation in y can be explained by the variation in the values of x? Modules 12 = Dashboard Google Drive Report answer as a percentage accurate to one decimal place. Office 365 Submit Question Courses Student Course Evaluations Calendar Inbox History Studio ? Help K 3:17 AM LO O W W O 64OF Clear ~ x ( () 8/1/2021
Step by Step Solution
There are 3 Steps involved in it

Get step-by-step solutions from verified subject matter experts