

Question: FINAL - Instructions for Part 2 - Coding Read the data in the file 'Final _ Exam _ Data.csv ' into a dataframe. The spreadsheet
FINAL Instructions for Part Coding
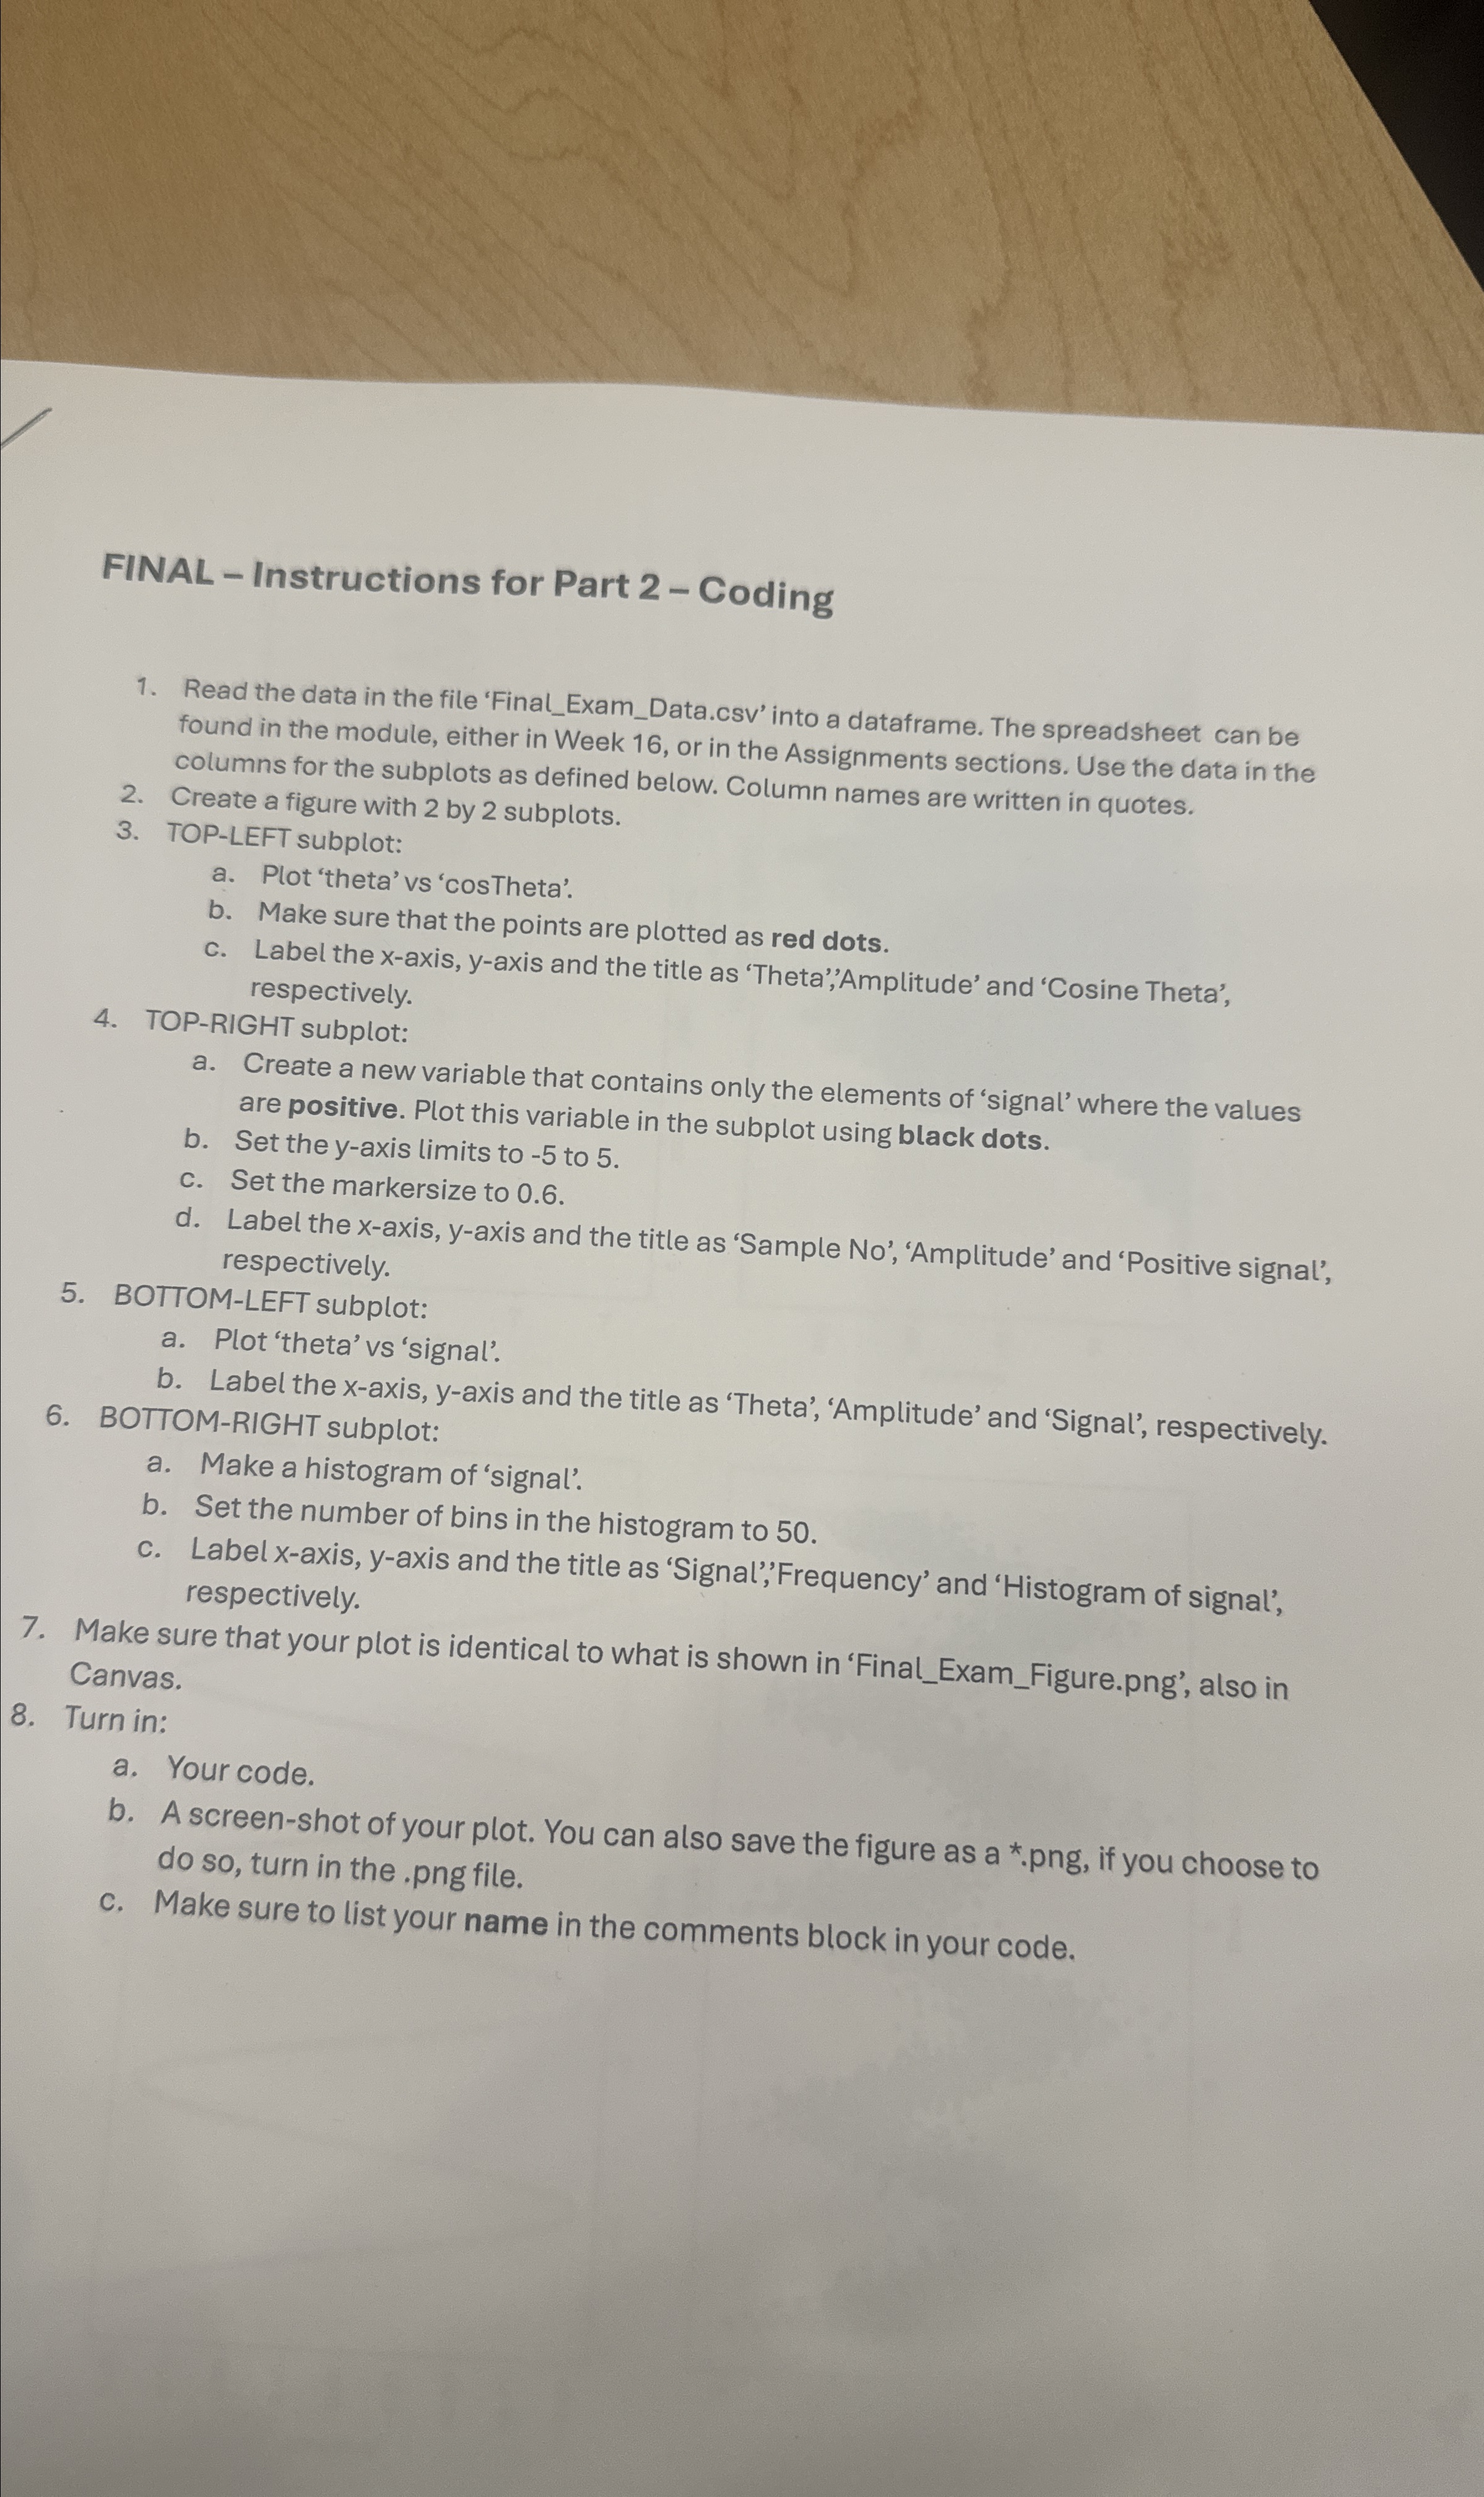
Read the data in the file 'FinalExamData.csv into a dataframe. The spreadsheet can be found in the module, either in Week or in the Assignments sections. Use the data in the columns for the subplots as defined below. Column names are written in quotes.
Create a figure with by subplots.
TOPLEFT subplot:
a Plot 'theta' vs 'cosTheta'.
b Make sure that the points are plotted as red dots.
c Label the axis, axis and the title as 'Theta','Amplitude' and 'Cosine Theta', respectively.
TOPRIGHT subplot:
a Create a new variable that contains only the elements of 'signal' where the values are positive. Plot this variable in the subplot using black dots.
b Set the axis limits to to
c Set the markersize to
d Label the axis, axis and the title as 'Sample No 'Amplitude' and 'Positive signal', respectively.
BOTTOMLEFT subplot:
a Plot 'theta' vs 'signal'.
b Label the axis, axis and the title as 'Theta', 'Amplitude' and 'Signal', respectively.
BOTTOMRIGHT subplot:
a Make a histogram of 'signal'.
b Set the number of bins in the histogram to
c Label axis, axis and the title as 'Signal','Frequency' and 'Histogram of signal', respectively.
Make sure that your plot is identical to what is shown in 'FinalExamFigure.png also in Canvas.
Turn in:
a Your code.
b A screenshot of your plot. You can also save the figure as a png if you choose to do so turn in the png file.
c Make sure to list your name in the comments block in your code.
Step by Step Solution
There are 3 Steps involved in it
1 Expert Approved Answer
Step: 1 Unlock

Question Has Been Solved by an Expert!
Get step-by-step solutions from verified subject matter experts
Step: 2 Unlock
Step: 3 Unlock