

Question: To compare the dry braking distances from 30 to 0 miles per hour for two makes of automobiles, a safety engineer conducts braking tests
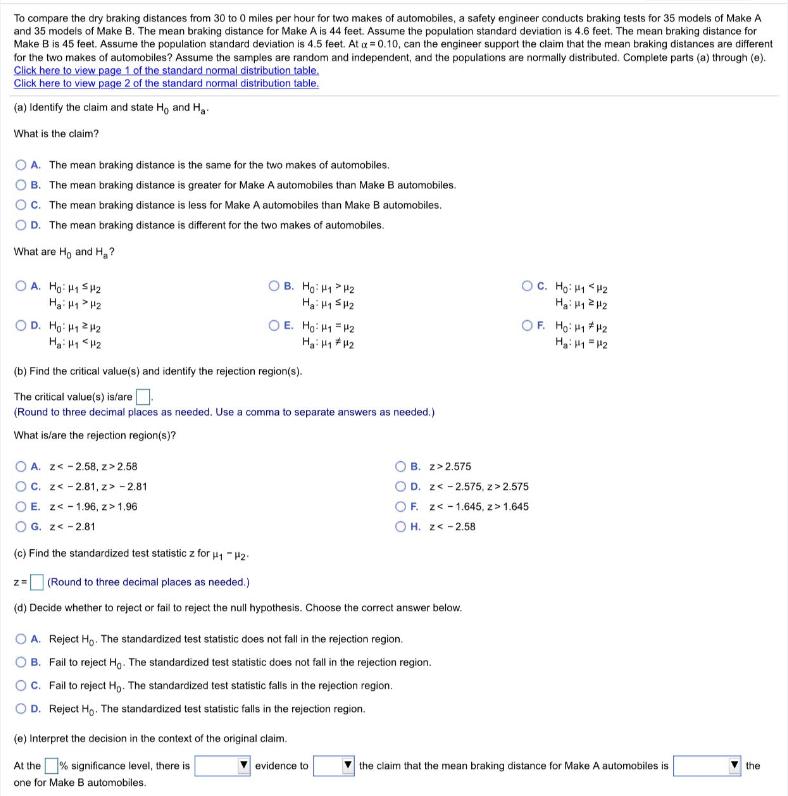
To compare the dry braking distances from 30 to 0 miles per hour for two makes of automobiles, a safety engineer conducts braking tests for 35 models of Make A and 35 models of Make B. The mean braking distance for Make A is 44 feet. Assume the population standard deviation is 4.6 feet. The mean braking distance for Make B is 45 feet. Assume the population standard deviation is 4.5 feet. At a = 0.10, can the engineer support the claim that the mean braking distances are different for the two makes of automobiles? Assume the samples are random and independent, and the populations are normally distributed. Complete parts (a) through (e). Click here to view page 1 of the standard normal distribution table. Click here to view page 2 of the standard normal distribution table. (a) Identify the claim and state Ho and H,. What is the claim? O A. The mean braking distance is the same for the two makes of automobiles. O B. The mean braking distance is greater for Make A automobiles than Make B automobiles. c. The mean braking distance is less for Make A automobiles than Make B automobiles. O D. The mean braking distance is different for the two makes of automobiles. What are Ho and H,? OA. Ho: H1 SH2 B. Hg: H1 H2 OC. Hg: H1 2.58 O B. z> 2.575 OC. z < -2.81, z> -2.81 OD. z < -2.575, z> 2.575 O E. z < - 1.96, z>1.96 OF. z < -1.645, z>1.645 O G. z < -2.81 O H. z < -2.58 (c) Find the standardized test statistic z for u1 "42- (Round to three decimal places as needed.) (d) Decide whether to reject or fail to reject the null hypothesis. Choose the correct answer below. A. Reject Hg. The standardized test statistic does not fall in the rejection region. B. Fail to reject Hg. The standardized test statistic does not fall in the rejection region. C. Fail to reject H,. The standardized test statistic falls in the rejection region. D. Reject Ho. The standardized test statistic falls in the rejection region. (e) Interpret the decision in the context of the original claim. At the % significance level, there is one for Make B automobiles. evidence to the claim that the mean braking distance for Make A automobiles is the
Step by Step Solution
There are 3 Steps involved in it

Get step-by-step solutions from verified subject matter experts