

Question: (Final2_Q2B) Another physics student conducts an experiment to characterize a different cart moving along a line. The student determines the velocity at different times, and
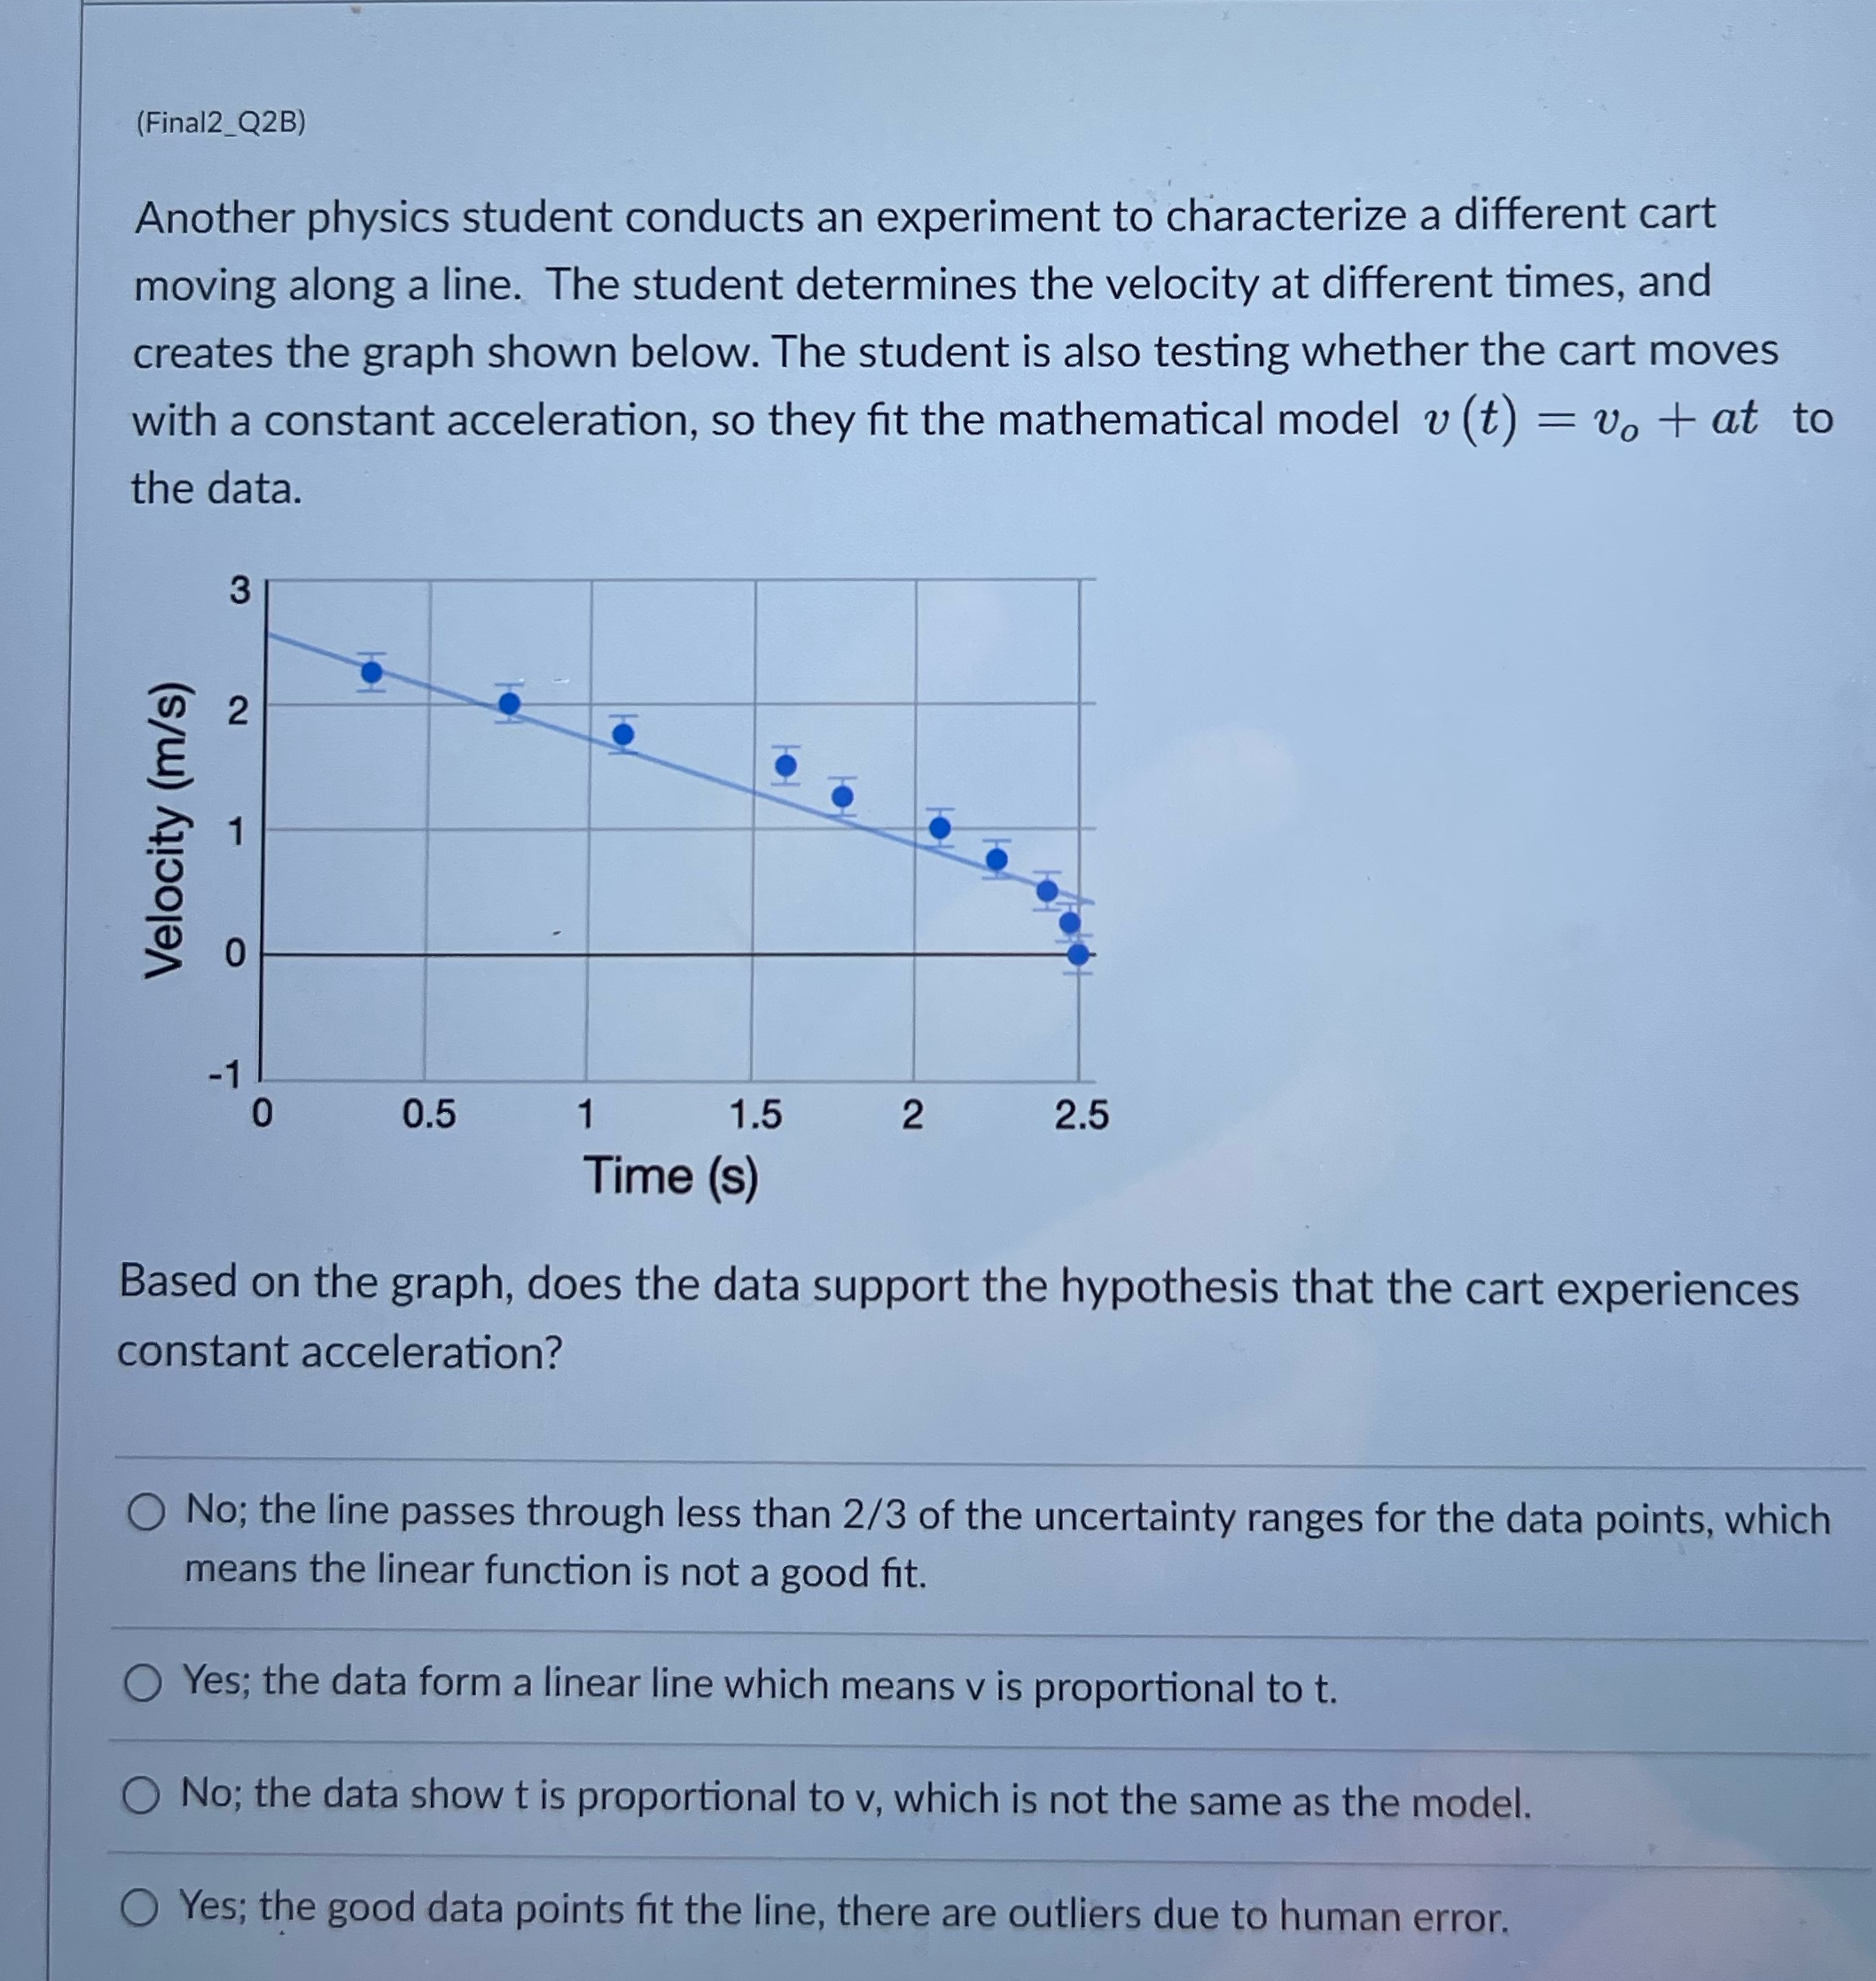
(Final2_Q2B) Another physics student conducts an experiment to characterize a different cart moving along a line. The student determines the velocity at different times, and creates the graph shown below. The student is also testing whether the cart moves with a constant acceleration, so they fit the mathematical model v (t) = v. + at to the data. 3 2 Velocity (m/s) 0 -1 0 0.5 1 1.5 2 2.5 Time (s) Based on the graph, does the data support the hypothesis that the cart experiences constant acceleration? No; the line passes through less than 2/3 of the uncertainty ranges for the data points, which means the linear function is not a good fit. Yes; the data form a linear line which means v is proportional to t. O No; the data show t is proportional to v, which is not the same as the model. Yes; the good data points fit the line, there are outliers due to human error
Step by Step Solution
There are 3 Steps involved in it

Get step-by-step solutions from verified subject matter experts