

Question: Finally, demonstrate the Central Limit Theorem (CLT) to yourself. Let X Unif (0,1). That is, X is a uniform random variable taking on values betveen
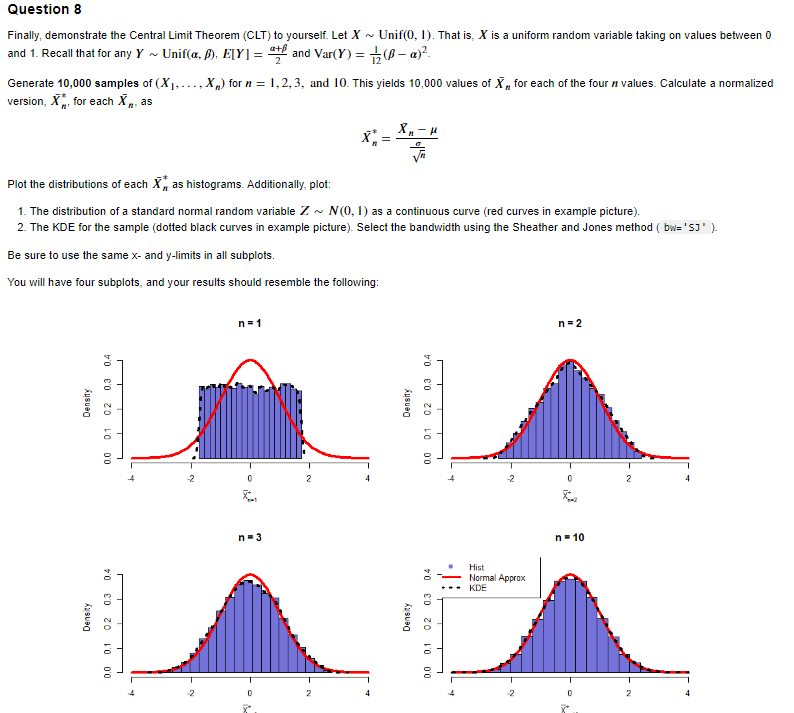
Finally, demonstrate the Central Limit Theorem (CLT) to yourself. Let X Unif (0,1). That is, X is a uniform random variable taking on values betveen 0 and 1. Recall that for any YUnif(,),E[Y]=2+ and Var(Y)=121()2. Generate 10,000 samples of (X1,,Xn) for n=1,2,3, and 10 . This yields 10,000 values of Xn for each of the four n values. Calculate a normalized version, Xn, for each Xn, as Xn=nXn Plot the distributions of each Xn as histograms. Additionally, plot: 1. The distribution of a standard normal random variable ZN(0,1) as a continuous curve (red curves in example picture). 2. The KDE for the sample (dotted black curves in example picture). Select the bandvidth using the Sheather and Jones method ( bw= 'SJ '). Be sure to use the same x - and y-limits in all subplots. You will have four subplots, and your results should resemble the following
Step by Step Solution
There are 3 Steps involved in it

Get step-by-step solutions from verified subject matter experts