

Question: Finance assignment P12 A B H K L M N D G Financial Management - Contributory Income Statements 2 1. Joe's Bistro has three sales
Finance assignment
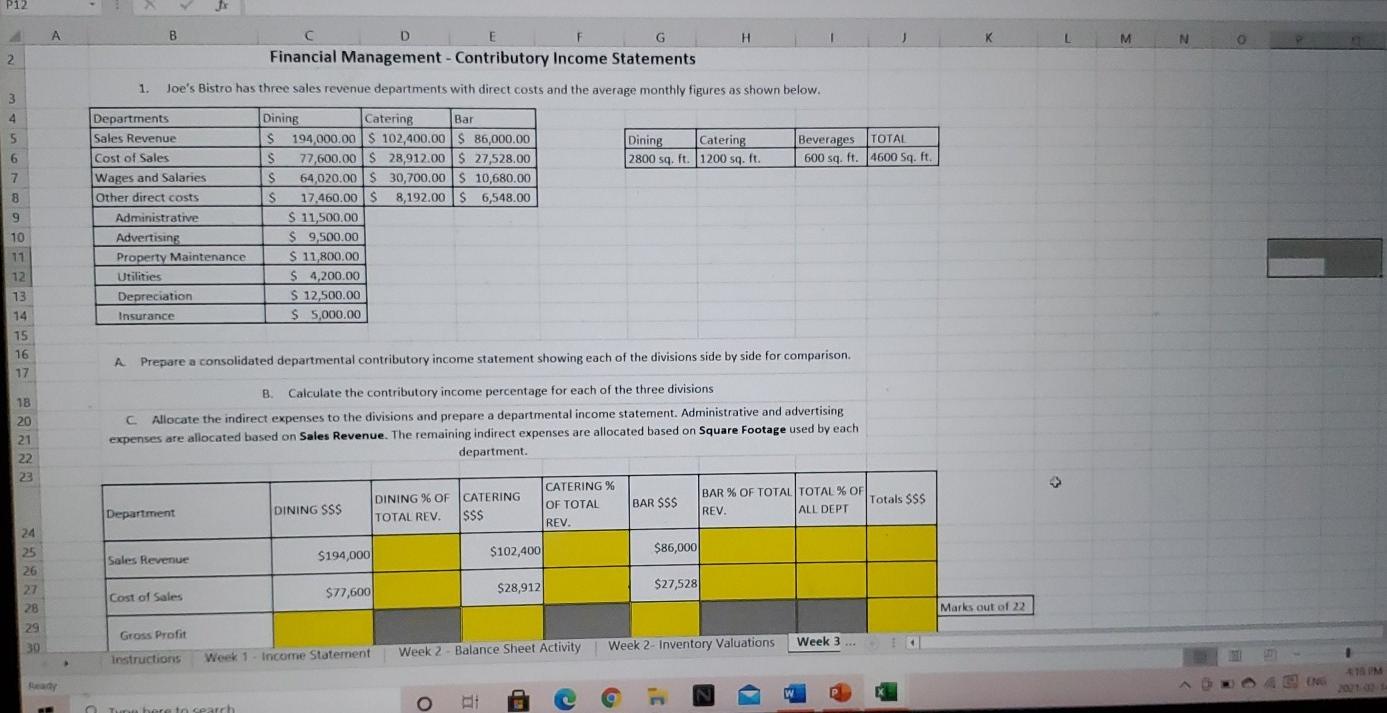
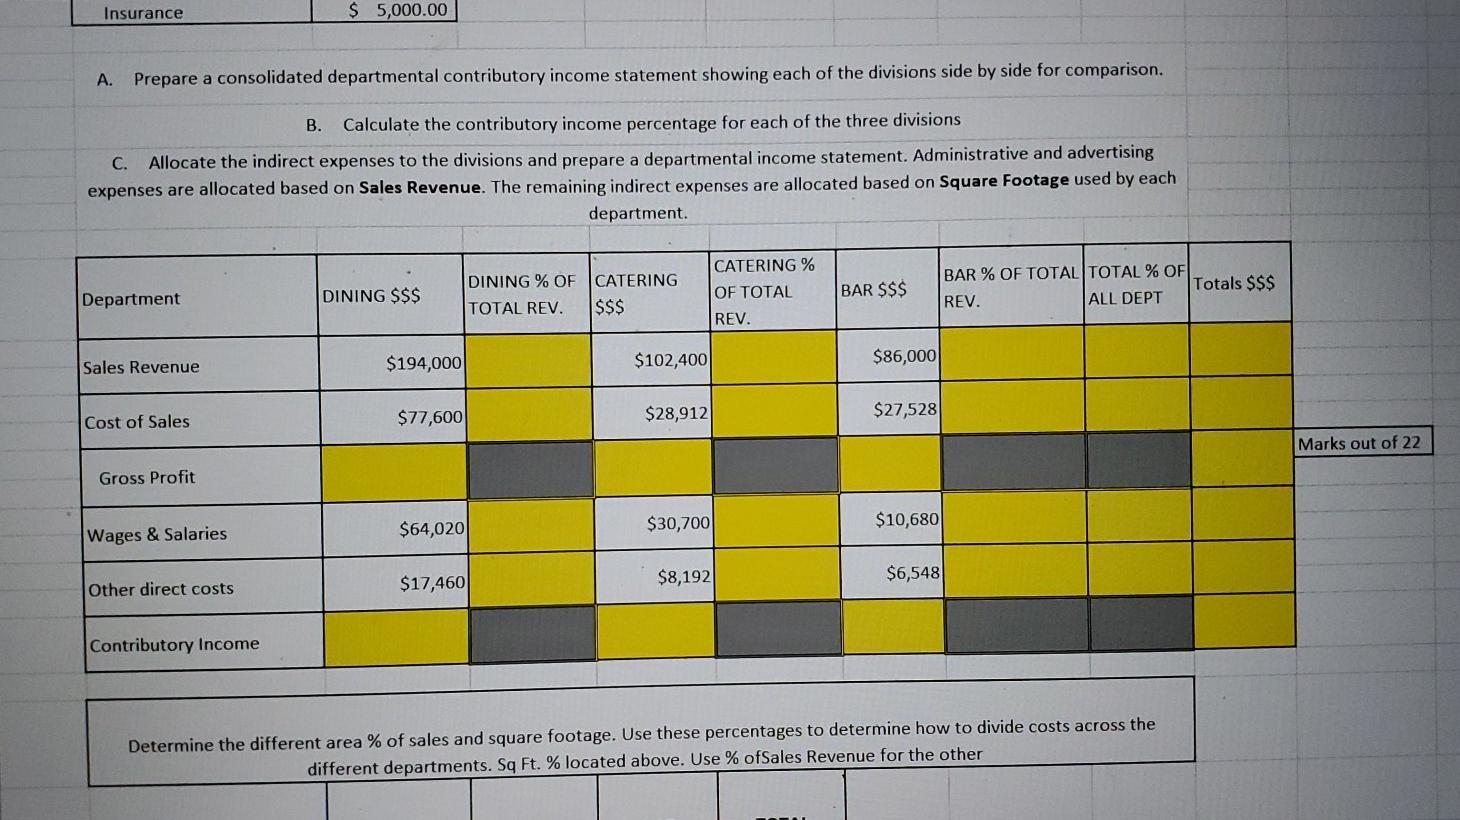
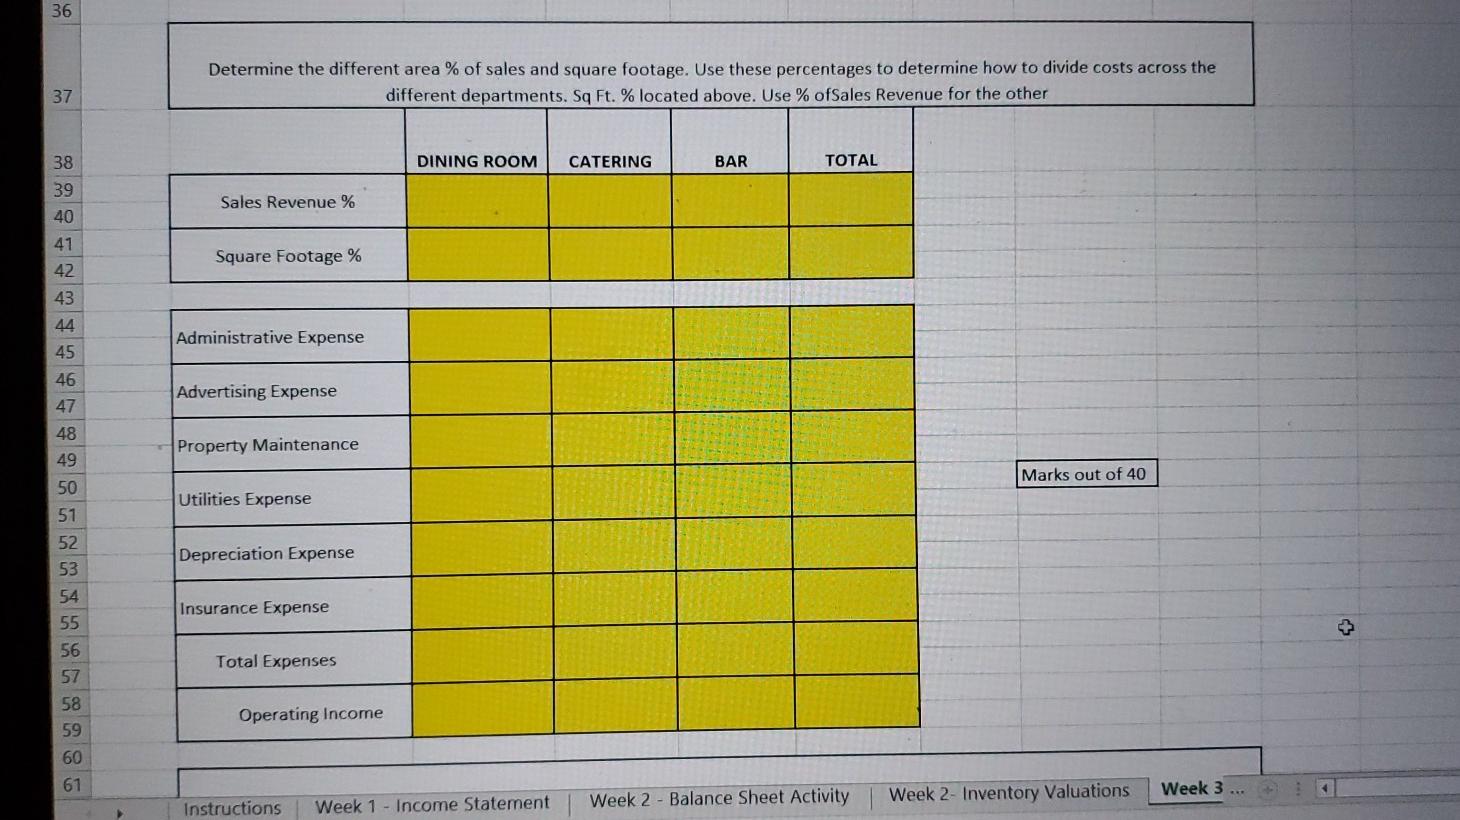
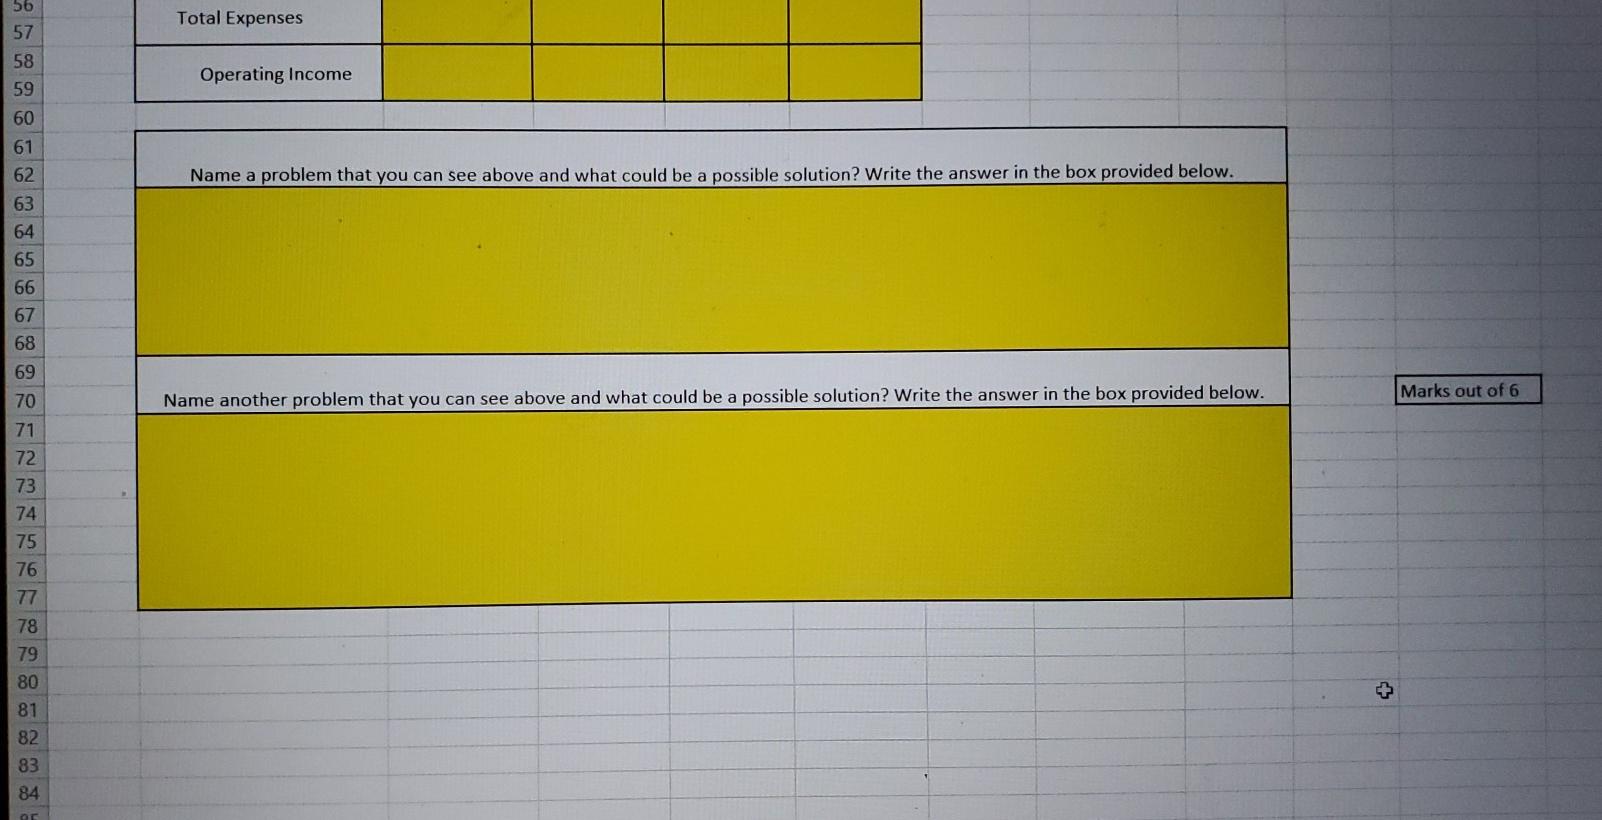
P12 A B H K L M N D G Financial Management - Contributory Income Statements 2 1. Joe's Bistro has three sales revenue departments with direct costs and the average monthly figures as shown below. 3 4 5 Dining Catering 2800 sq. ft. 1200 sq. ft. Beverages TOTAL 600 sq. ft. 4600 Sq. ft. 6 7 8 9 Departments Sales Revenue Cost of Sales Wages and Salaries Other direct costs Administrative Advertising Property Maintenance Utilities Depreciation Insurance Dining Catering Bar S $ 194,000.00 $ 102,400.00 $ 86,000.00 s 77,600.00 $ 28,912.00 $ 27,528,00 S 64,020.00$ 30,700.00 S 10,680.00 $ 17.460.00 $ 8,192.00S 6,548.00 $ 11,500.00 $ 9,500.00 $ 11,800.00 $ 4,200.00 $ 12,500.00 $5,000.00 10 11 12 13 14 15 16 A Prepare a consolidated departmental contributory income statement showing each of the divisions side by side for comparison 17 18 20 21 22 23 B. Calculate the contributory income percentage for each of the three divisions Allocate the indirect expenses to the divisions and prepare a departmental income statement. Administrative and advertising expenses are allocated based on Sales Revenue. The remaining indirect expenses are allocated based on Square Footage used by each department. CATERING % OF TOTAL REV. BAR SSS DINING % OF CATERING TOTAL REV. $S$ BAR % OF TOTAL TOTAL % OF REV ALL DEPT Totals SSS Department DINING SSS 24 $194,000 $102,400 Sales Revenue $86,000 26 27 28 $28,912 $27,528 Cost of Sales $77,600 Marks out of 22 29 Gross Profit 30 Week 2- Inventory Valuations Week 3 ... Week 2 Balance Sheet Activity instructions Week 1 - Income Statement P baratearch t o Insurance $ 5,000.00 A. Prepare a consolidated departmental contributory income statement showing each of the divisions side by side for comparison. B. Calculate the contributory income percentage for each of the three divisions C. Allocate the indirect expenses to the divisions and prepare a departmental income statement. Administrative and advertising expenses are allocated based on Sales Revenue. The remaining indirect expenses are allocated based on Square Footage used by each department DINING $$$ DINING % OF TOTAL REV. Department CATERING $$$ CATERING % OF TOTAL REV. BAR $$$ BAR % OF TOTAL TOTAL % OF Totals $$$ REV. ALL DEPT $194,000 Sales Revenue $102,400 $86,000 $28,912 $27,528 $77,600 Cost of Sales Marks out of 22 Gross Profit $64,020 $30,700 $10,680 Wages & Salaries $17,460 $8,192 $6,548 Other direct costs Contributory Income Determine the different area % of sales and square footage. Use these percentages to determine how to divide costs across the different departments. Sq Ft. % located above. Use % ofSales Revenue for the other 36 Determine the different area % of sales and square footage. Use these percentages to determine how to divide costs across the different departments. Sq Ft. % located above. Use % ofSales Revenue for the other 37 DINING ROOM CATERING BAR TOTAL 38 39 40 Sales Revenue % 41 42 Square Footage % Administrative Expense 43 44 45 46 47 Advertising Expense 48 Property Maintenance 49 Marks out of 40 50 Utilities Expense 51 52 Depreciation Expense 53 54 Insurance Expense 55 Total Expenses 56 57 58 Operating Income 59 60 61 Week 2- Inventory Valuations Week 3 ... Instructions Week 1 - Income Statement Week 2 - Balance Sheet Activity Total Expenses 56 57 58 Operating Income 59 60 61 62 Name a problem that you can see above and what could be a possible solution? Write the answer in the box provided below. 63 64 65 66 67 68 69 Marks out of 6 Name another problem that you can see above and what could be a possible solution? Write the answer in the box provided below. 70 71 72 73 74 75 76 77 78 79 80 81 82 83 84 P12 A B H K L M N D G Financial Management - Contributory Income Statements 2 1. Joe's Bistro has three sales revenue departments with direct costs and the average monthly figures as shown below. 3 4 5 Dining Catering 2800 sq. ft. 1200 sq. ft. Beverages TOTAL 600 sq. ft. 4600 Sq. ft. 6 7 8 9 Departments Sales Revenue Cost of Sales Wages and Salaries Other direct costs Administrative Advertising Property Maintenance Utilities Depreciation Insurance Dining Catering Bar S $ 194,000.00 $ 102,400.00 $ 86,000.00 s 77,600.00 $ 28,912.00 $ 27,528,00 S 64,020.00$ 30,700.00 S 10,680.00 $ 17.460.00 $ 8,192.00S 6,548.00 $ 11,500.00 $ 9,500.00 $ 11,800.00 $ 4,200.00 $ 12,500.00 $5,000.00 10 11 12 13 14 15 16 A Prepare a consolidated departmental contributory income statement showing each of the divisions side by side for comparison 17 18 20 21 22 23 B. Calculate the contributory income percentage for each of the three divisions Allocate the indirect expenses to the divisions and prepare a departmental income statement. Administrative and advertising expenses are allocated based on Sales Revenue. The remaining indirect expenses are allocated based on Square Footage used by each department. CATERING % OF TOTAL REV. BAR SSS DINING % OF CATERING TOTAL REV. $S$ BAR % OF TOTAL TOTAL % OF REV ALL DEPT Totals SSS Department DINING SSS 24 $194,000 $102,400 Sales Revenue $86,000 26 27 28 $28,912 $27,528 Cost of Sales $77,600 Marks out of 22 29 Gross Profit 30 Week 2- Inventory Valuations Week 3 ... Week 2 Balance Sheet Activity instructions Week 1 - Income Statement P baratearch t o Insurance $ 5,000.00 A. Prepare a consolidated departmental contributory income statement showing each of the divisions side by side for comparison. B. Calculate the contributory income percentage for each of the three divisions C. Allocate the indirect expenses to the divisions and prepare a departmental income statement. Administrative and advertising expenses are allocated based on Sales Revenue. The remaining indirect expenses are allocated based on Square Footage used by each department DINING $$$ DINING % OF TOTAL REV. Department CATERING $$$ CATERING % OF TOTAL REV. BAR $$$ BAR % OF TOTAL TOTAL % OF Totals $$$ REV. ALL DEPT $194,000 Sales Revenue $102,400 $86,000 $28,912 $27,528 $77,600 Cost of Sales Marks out of 22 Gross Profit $64,020 $30,700 $10,680 Wages & Salaries $17,460 $8,192 $6,548 Other direct costs Contributory Income Determine the different area % of sales and square footage. Use these percentages to determine how to divide costs across the different departments. Sq Ft. % located above. Use % ofSales Revenue for the other 36 Determine the different area % of sales and square footage. Use these percentages to determine how to divide costs across the different departments. Sq Ft. % located above. Use % ofSales Revenue for the other 37 DINING ROOM CATERING BAR TOTAL 38 39 40 Sales Revenue % 41 42 Square Footage % Administrative Expense 43 44 45 46 47 Advertising Expense 48 Property Maintenance 49 Marks out of 40 50 Utilities Expense 51 52 Depreciation Expense 53 54 Insurance Expense 55 Total Expenses 56 57 58 Operating Income 59 60 61 Week 2- Inventory Valuations Week 3 ... Instructions Week 1 - Income Statement Week 2 - Balance Sheet Activity Total Expenses 56 57 58 Operating Income 59 60 61 62 Name a problem that you can see above and what could be a possible solution? Write the answer in the box provided below. 63 64 65 66 67 68 69 Marks out of 6 Name another problem that you can see above and what could be a possible solution? Write the answer in the box provided below. 70 71 72 73 74 75 76 77 78 79 80 81 82 83 84
Step by Step Solution
There are 3 Steps involved in it

Get step-by-step solutions from verified subject matter experts