

Question: Finance Homework Help 9. (Financial statement analysis) Carson Electronics' management has long viewed BGT Electronics as an industry leader and uses this firm as a
Finance Homework Help
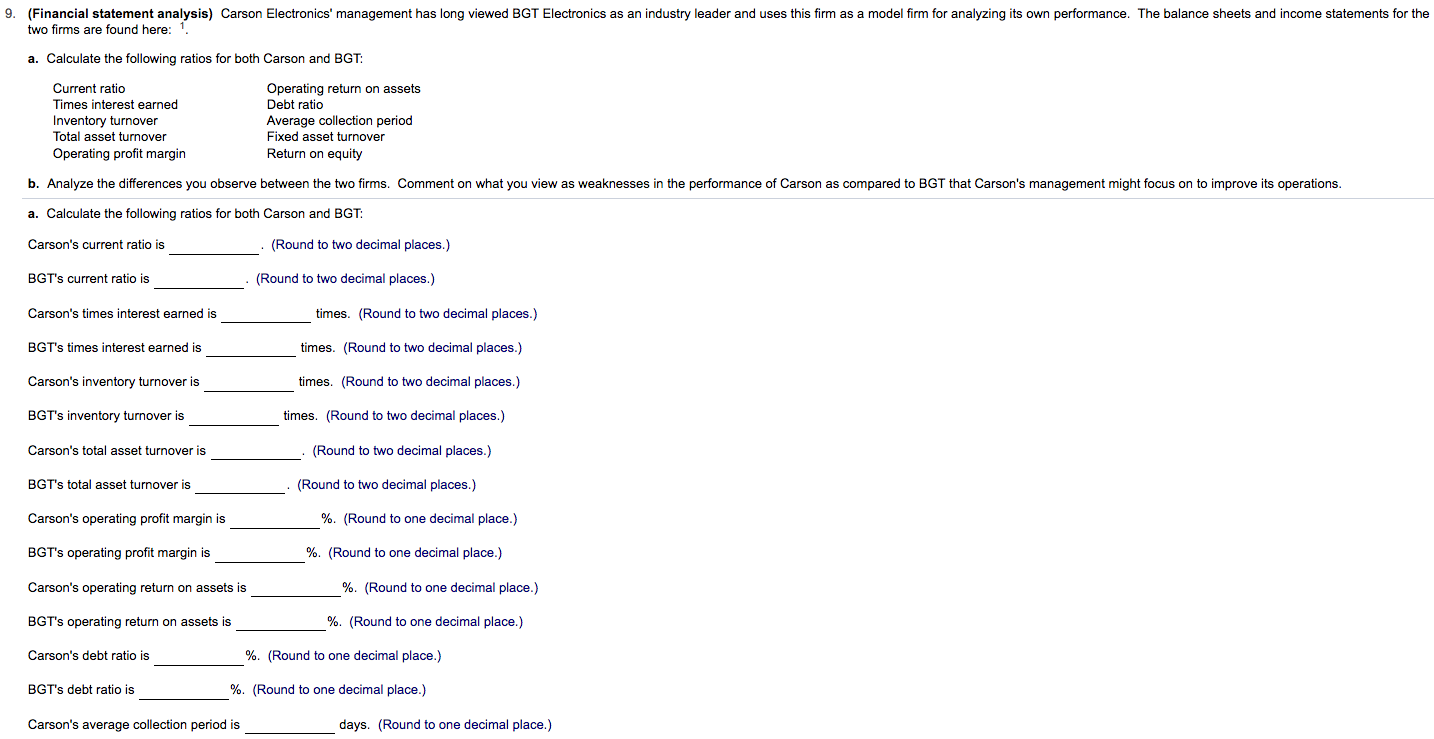
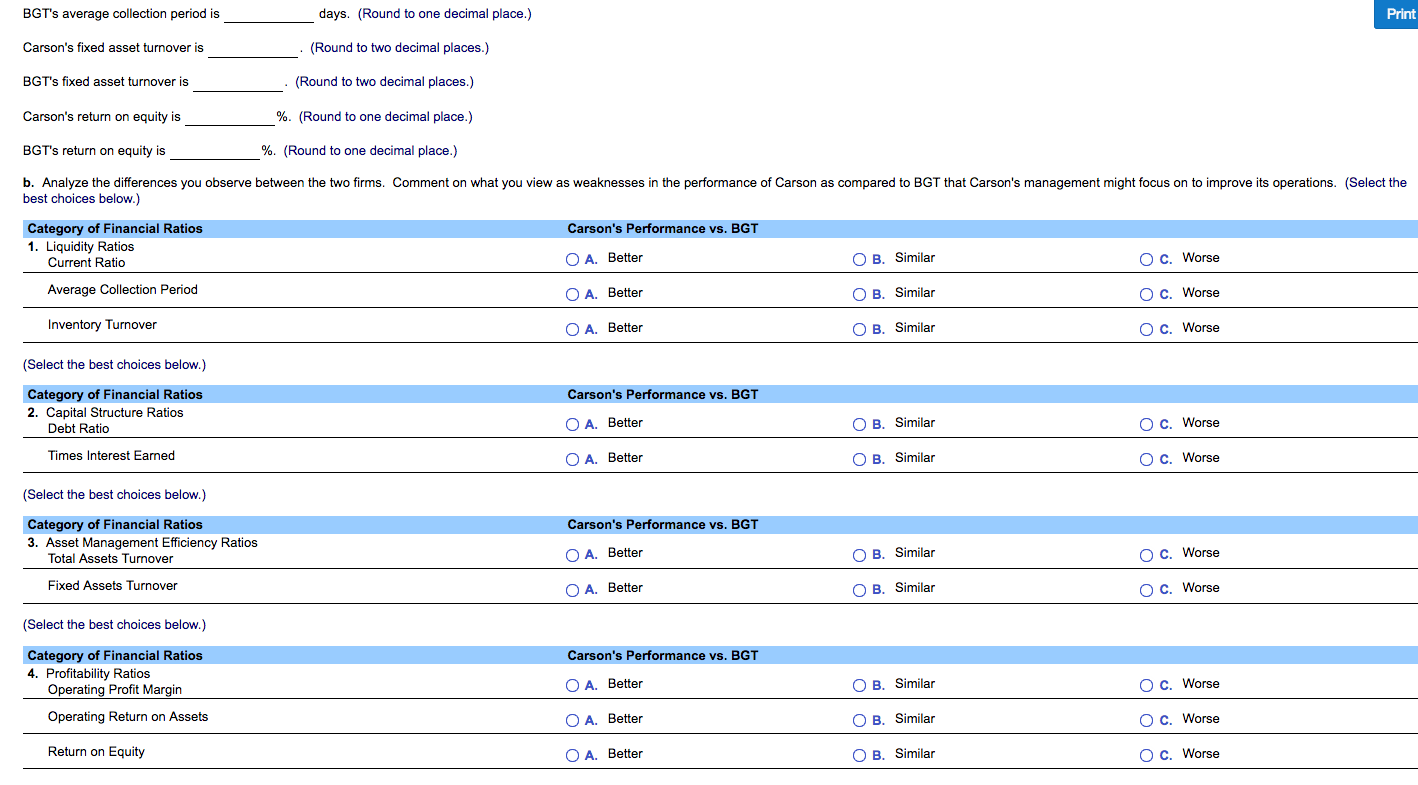
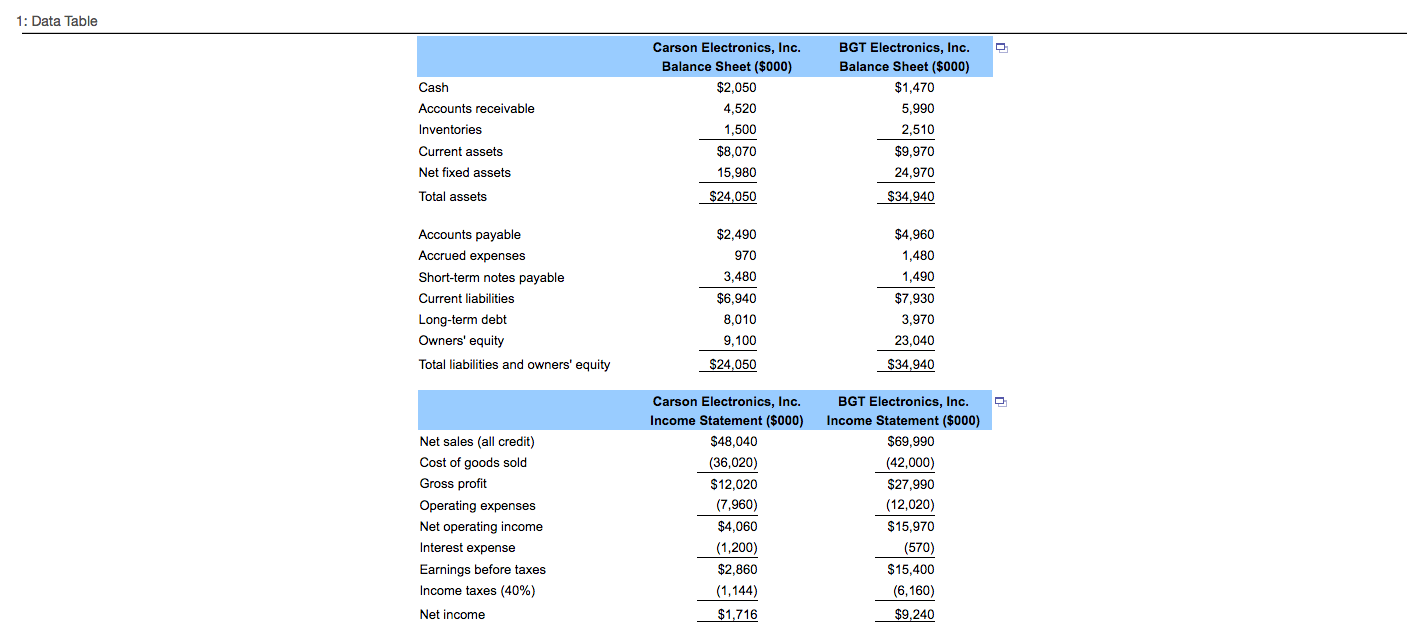
9. (Financial statement analysis) Carson Electronics' management has long viewed BGT Electronics as an industry leader and uses this firm as a model firm for analyzing its own performance. The balance sheets and income statements for the two firms are found here: 1. a. Calculate the following ratios for both Carson and BGT: Current ratio Times interest earned Inventory turnover Total asset turnover Operating profit margin Operating return on assets Debt ratio Average collection period Fixed asset turnover Return on equity b. Analyze the differences you observe between the two firms. Comment on what you view as weaknesses in the performance of Carson as compared to BGT that Carson's management might focus on to improve its operations. a. Calculate the following ratios for both Carson and BGT: Carson's current ratio is (Round to two decimal places.) BGT's current ratio is (Round to two decimal places.) Carson's times interest earned is times. (Round to two decimal places.) BGT's times interest earned is times. (Round to two decimal places.) Carson's inventory turnover is times. (Round to two decimal places.) BGT's inventory turnover is times. (Round to two decimal places.) Carson's total asset turnover is (Round to two decimal places.) BGT's total asset turnover is (Round to two decimal places.) Carson's operating profit margin is %. (Round to one decimal place.) BGT's operating profit margin is %. (Round to one decimal place.) Carson's operating return on assets is %. (Round to one decimal place.) BGT's operating return on assets is %. (Round to one decimal place.) Carson's debt ratio is % (Round to one decimal place.) BGT's debt ratio is %. (Round to one decimal place.) Carson's average collection period is days. (Round to one decimal place.) BGT's average collection period is days. (Round to one decimal place.) Print Carson's fixed asset turnover is (Round to two decimal places.) BGT's fixed asset turnover is (Round to two decimal places.) Carson's return on equity is %. (Round to one decimal place.) BGT's return on equity is %. (Round to one decimal place.) b. Analyze the differences you observe between the two firms. Comment on what you view as weaknesses in the performance of Carson as compared to BGT that Carson's management might focus on to improve its operations. (Select the best choices below.) Carson's Performance vs. BGT Category of Financial Ratios 1. Liquidity Ratios Current Ratio O A. Better OB. Similar O c. Worse Average Collection Period O A. Better OB. Similar Oc. Worse Inventory Turnover A. Better OB. Similar O C. Worse (Select the best choices below.) Carson's Performance vs. BGT Category of Financial Ratios 2. Capital Structure Ratios Debt Ratio O A. Better OB. Similar O C. Worse Times Interest Earned O A Better OB. Similar O C. Worse (Select the best choices below.) Carson's Performance vs. BGT Category of Financial Ratios 3. Asset Management Efficiency Ratios Total Assets Turnover O A. Better OB. Similar O C. Worse Fixed Assets Turnover O A. Better OB. Similar O C. Worse (Select the best choices below.) Carson's Performance vs. BGT Category of Financial Ratios 4. Profitability Ratios Operating Profit Margin Operating Return on Assets O A. Better OB. Similar O C. Worse O A. Better OB. Similar O C. Worse Return on Equity O A. Better OB. Similar O C. Worse 1: Data Table BGT Electronics, Inc. Balance Sheet($000) $1,470 Cash Accounts receivable Inventories Current assets Net fixed assets Carson Electronics, Inc. Balance Sheet($000) $2,050 4,520 1,500 $8,070 15,980 $24,050 5,990 2,510 $9,970 24,970 Total assets $34,940 $4,960 1,480 Accounts payable Accrued expenses Short-term notes payable Current liabilities Long-term debt Owners' equity Total liabilities and owners' equity $2,490 970 3,480 $6,940 8,010 9,100 1,490 $7,930 3,970 23,040 $24,050 $34,940 Net sales (all credit) Cos goods Gross profit Operating expenses Net operating income Interest expense Earnings before taxes Income taxes (40%) Carson Electronics, Inc. Income Statement ($000) $48,040 (36,020) $12,020 (7,960) $4,060 (1,200) $2,860 (1,144) BGT Electronics, Inc. Income Statement ($000) $69,990 (42,000) $27.990 (12,020) $15,970 (570) $15,400 (6,160) $9,240 Net income $1,716 9. (Financial statement analysis) Carson Electronics' management has long viewed BGT Electronics as an industry leader and uses this firm as a model firm for analyzing its own performance. The balance sheets and income statements for the two firms are found here: 1. a. Calculate the following ratios for both Carson and BGT: Current ratio Times interest earned Inventory turnover Total asset turnover Operating profit margin Operating return on assets Debt ratio Average collection period Fixed asset turnover Return on equity b. Analyze the differences you observe between the two firms. Comment on what you view as weaknesses in the performance of Carson as compared to BGT that Carson's management might focus on to improve its operations. a. Calculate the following ratios for both Carson and BGT: Carson's current ratio is (Round to two decimal places.) BGT's current ratio is (Round to two decimal places.) Carson's times interest earned is times. (Round to two decimal places.) BGT's times interest earned is times. (Round to two decimal places.) Carson's inventory turnover is times. (Round to two decimal places.) BGT's inventory turnover is times. (Round to two decimal places.) Carson's total asset turnover is (Round to two decimal places.) BGT's total asset turnover is (Round to two decimal places.) Carson's operating profit margin is %. (Round to one decimal place.) BGT's operating profit margin is %. (Round to one decimal place.) Carson's operating return on assets is %. (Round to one decimal place.) BGT's operating return on assets is %. (Round to one decimal place.) Carson's debt ratio is % (Round to one decimal place.) BGT's debt ratio is %. (Round to one decimal place.) Carson's average collection period is days. (Round to one decimal place.) BGT's average collection period is days. (Round to one decimal place.) Print Carson's fixed asset turnover is (Round to two decimal places.) BGT's fixed asset turnover is (Round to two decimal places.) Carson's return on equity is %. (Round to one decimal place.) BGT's return on equity is %. (Round to one decimal place.) b. Analyze the differences you observe between the two firms. Comment on what you view as weaknesses in the performance of Carson as compared to BGT that Carson's management might focus on to improve its operations. (Select the best choices below.) Carson's Performance vs. BGT Category of Financial Ratios 1. Liquidity Ratios Current Ratio O A. Better OB. Similar O c. Worse Average Collection Period O A. Better OB. Similar Oc. Worse Inventory Turnover A. Better OB. Similar O C. Worse (Select the best choices below.) Carson's Performance vs. BGT Category of Financial Ratios 2. Capital Structure Ratios Debt Ratio O A. Better OB. Similar O C. Worse Times Interest Earned O A Better OB. Similar O C. Worse (Select the best choices below.) Carson's Performance vs. BGT Category of Financial Ratios 3. Asset Management Efficiency Ratios Total Assets Turnover O A. Better OB. Similar O C. Worse Fixed Assets Turnover O A. Better OB. Similar O C. Worse (Select the best choices below.) Carson's Performance vs. BGT Category of Financial Ratios 4. Profitability Ratios Operating Profit Margin Operating Return on Assets O A. Better OB. Similar O C. Worse O A. Better OB. Similar O C. Worse Return on Equity O A. Better OB. Similar O C. Worse 1: Data Table BGT Electronics, Inc. Balance Sheet($000) $1,470 Cash Accounts receivable Inventories Current assets Net fixed assets Carson Electronics, Inc. Balance Sheet($000) $2,050 4,520 1,500 $8,070 15,980 $24,050 5,990 2,510 $9,970 24,970 Total assets $34,940 $4,960 1,480 Accounts payable Accrued expenses Short-term notes payable Current liabilities Long-term debt Owners' equity Total liabilities and owners' equity $2,490 970 3,480 $6,940 8,010 9,100 1,490 $7,930 3,970 23,040 $24,050 $34,940 Net sales (all credit) Cos goods Gross profit Operating expenses Net operating income Interest expense Earnings before taxes Income taxes (40%) Carson Electronics, Inc. Income Statement ($000) $48,040 (36,020) $12,020 (7,960) $4,060 (1,200) $2,860 (1,144) BGT Electronics, Inc. Income Statement ($000) $69,990 (42,000) $27.990 (12,020) $15,970 (570) $15,400 (6,160) $9,240 Net income $1,716
Step by Step Solution
There are 3 Steps involved in it

Get step-by-step solutions from verified subject matter experts