

Question: FINANCE PLEASE HELP Using Table 3.6, calculate the marginal and average tax rates for a single taxpayer with the following incomes: (Do not round intermediate
FINANCE PLEASE HELP
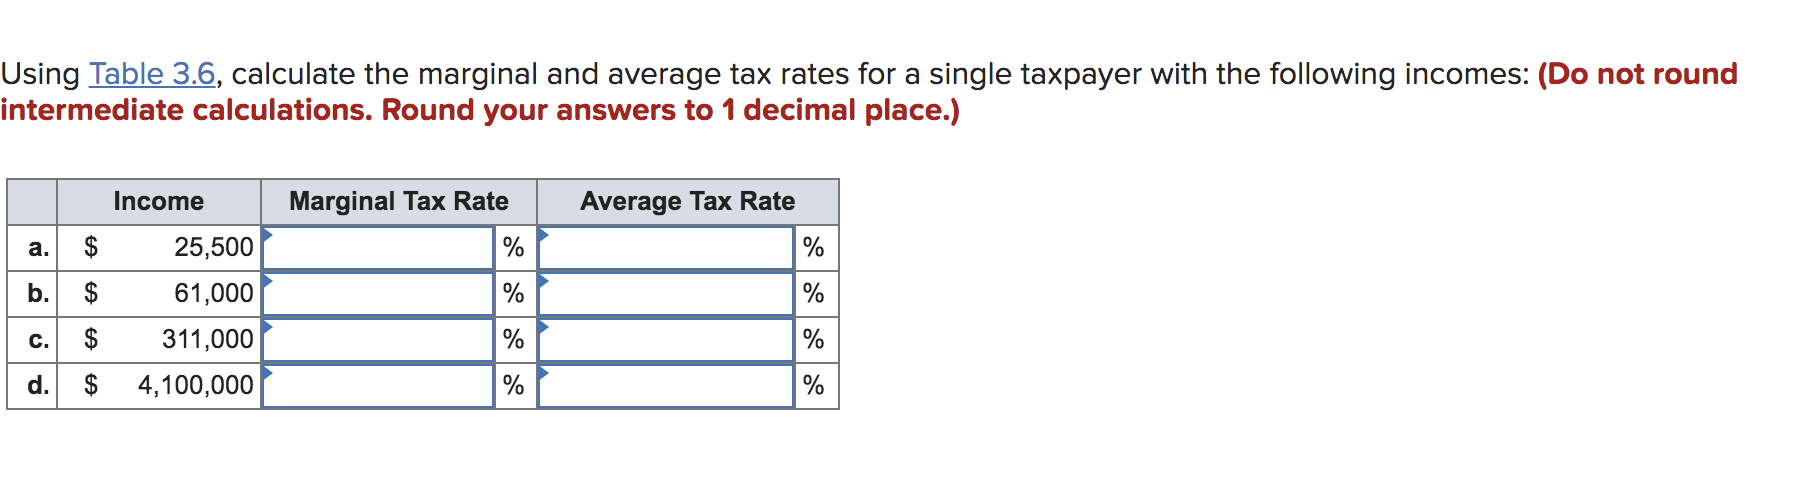
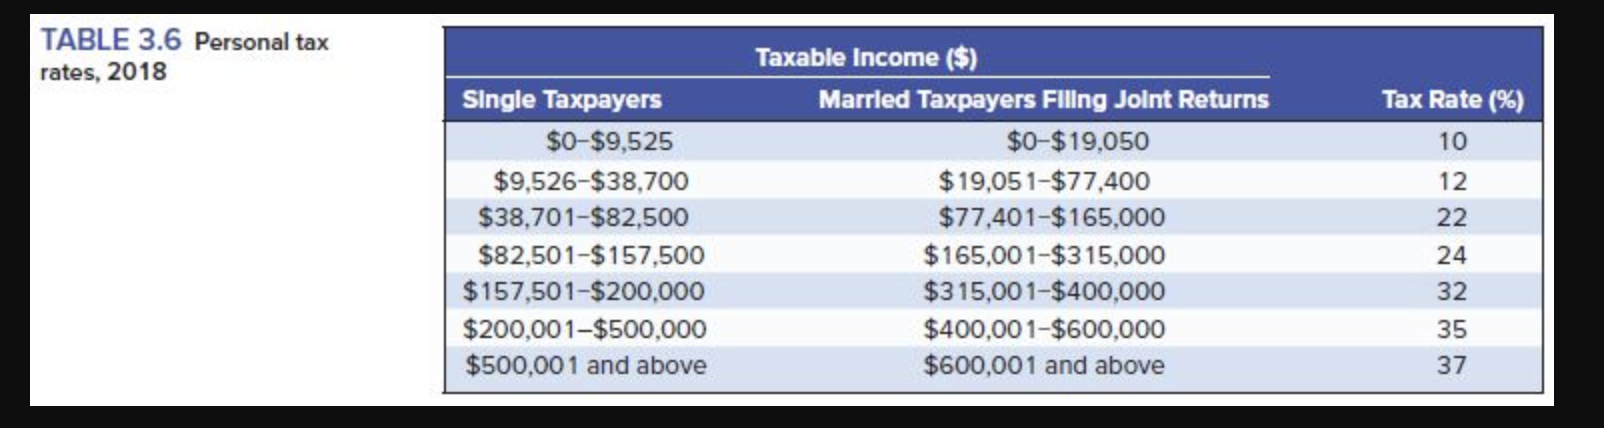
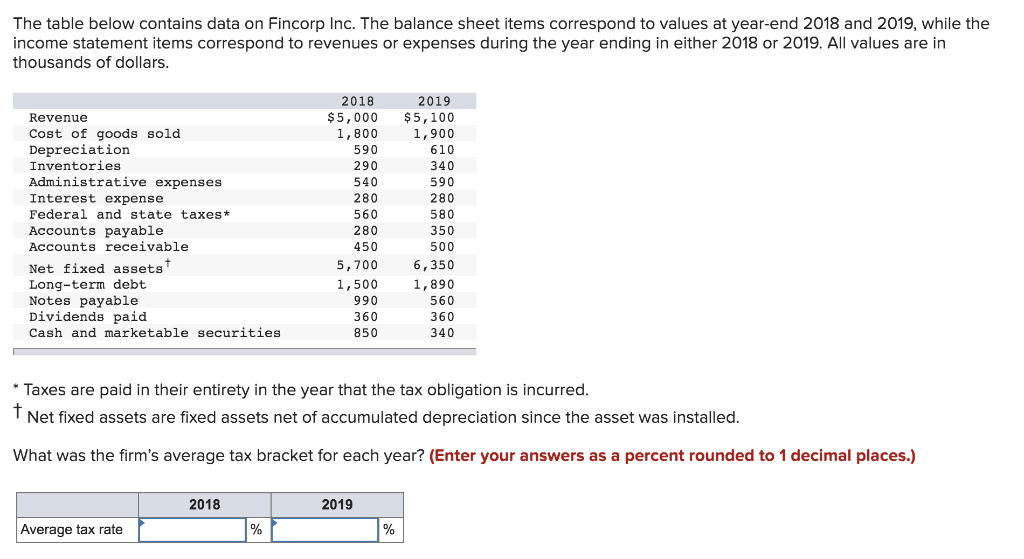
Using Table 3.6, calculate the marginal and average tax rates for a single taxpayer with the following incomes: (Do not round intermediate calculations. Round your answers to 1 decimal place.) Income Marginal Tax Rate % Average Tax Rate % a. $ b. $ c. $ 25,500 61,000 % % % 311,000 4,100,000 % % d. $ % TABLE 3.6 Personal tax rates, 2018 Tax Rate (%) 10 12 Single Taxpayers $0-$9,525 $9,526-$38,700 $38,701-$82,500 $82,501-$157,500 $157,501-$200,000 $200,001-$500,000 $500,00 1 and above Taxable Income ($) Married Taxpayers Flling Joint Returns $0-$19,050 $19,051-$77,400 $77,401-$165,000 $165,00 1-$315,000 $315,00 1-$400,000 $400,001-$600,000 $600,001 and above 22 24 32 W 35 37 The table below contains data on Fincorp Inc. The balance sheet items correspond to values at year-end 2018 and 2019, while the income statement items correspond to revenues or expenses during the year ending in either 2018 or 2019. All values are in thousands of dollars. Revenue Cost of goods sold Depreciation Administrative expenses Interest expense Federal and state taxes* Accounts payable Accounts receivable Net fixed assets Long-term debt Notes payable Dividends paid Cash and marketable securities 2018 $5,000 1,800 590 290 540 280 560 280 450 5,700 1,500 990 360 850 2019 $5,100 1,900 610 340 590 200 280 580 350 500 6,350 1,890 560 360 340 * Taxes are paid in their entirety in the year that the tax obligation is incurred. + Net fixed assets are fixed assets net of accumulated depreciation since the asset was installed. What was the firm's average tax bracket for each year? (Enter your answers as a percent rounded to 1 decimal places.) 2018 2019 Average tax rate % %
Step by Step Solution
There are 3 Steps involved in it

Get step-by-step solutions from verified subject matter experts