

Question: Financial Analysis (4 pages max) D2L Financial Template (16 marks for all calculations; 4 marks for noting the relevant strategic impacts and stating a general
- Financial Analysis (4 pages max) D2L Financial Template (16 marks for all calculations; 4 marks for noting the relevant strategic impacts and stating a general conclusion.)
Evaluate the current financial health of the company by presenting your findings of relevant financial information based on a subset of the following:
Ratios: 1) liquidity 2) profitability, 3) leverage, 4) efficiency, 5) operating, and 6) market value and investment ratios. (See the template)
Also, using trend analysis, and/or common size analysis, and/or longitudinal analysis based on CAGR (Compound Annual Growth Rate see CAGR in Investopedia.com ) to either reinforce staying with the companys status quo or to suggest changes in strategy in light of the results.
If applicable, also include competitive financial analysis and/or other relevant financial findings by investigating all quantitative information provided.
For each of your calculations or observations note whether a trend is up, down or flat (see template) and note the strategic impact of each finding.
A concluding summary statement should address the strategic implications arising from your analysis of the financial health of the company.
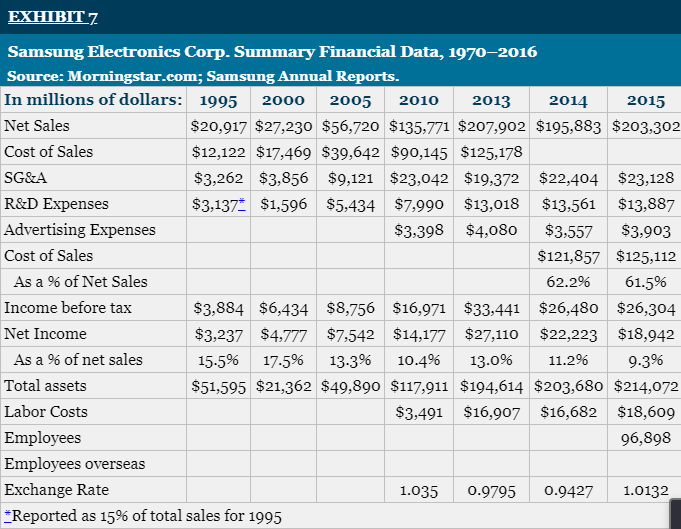
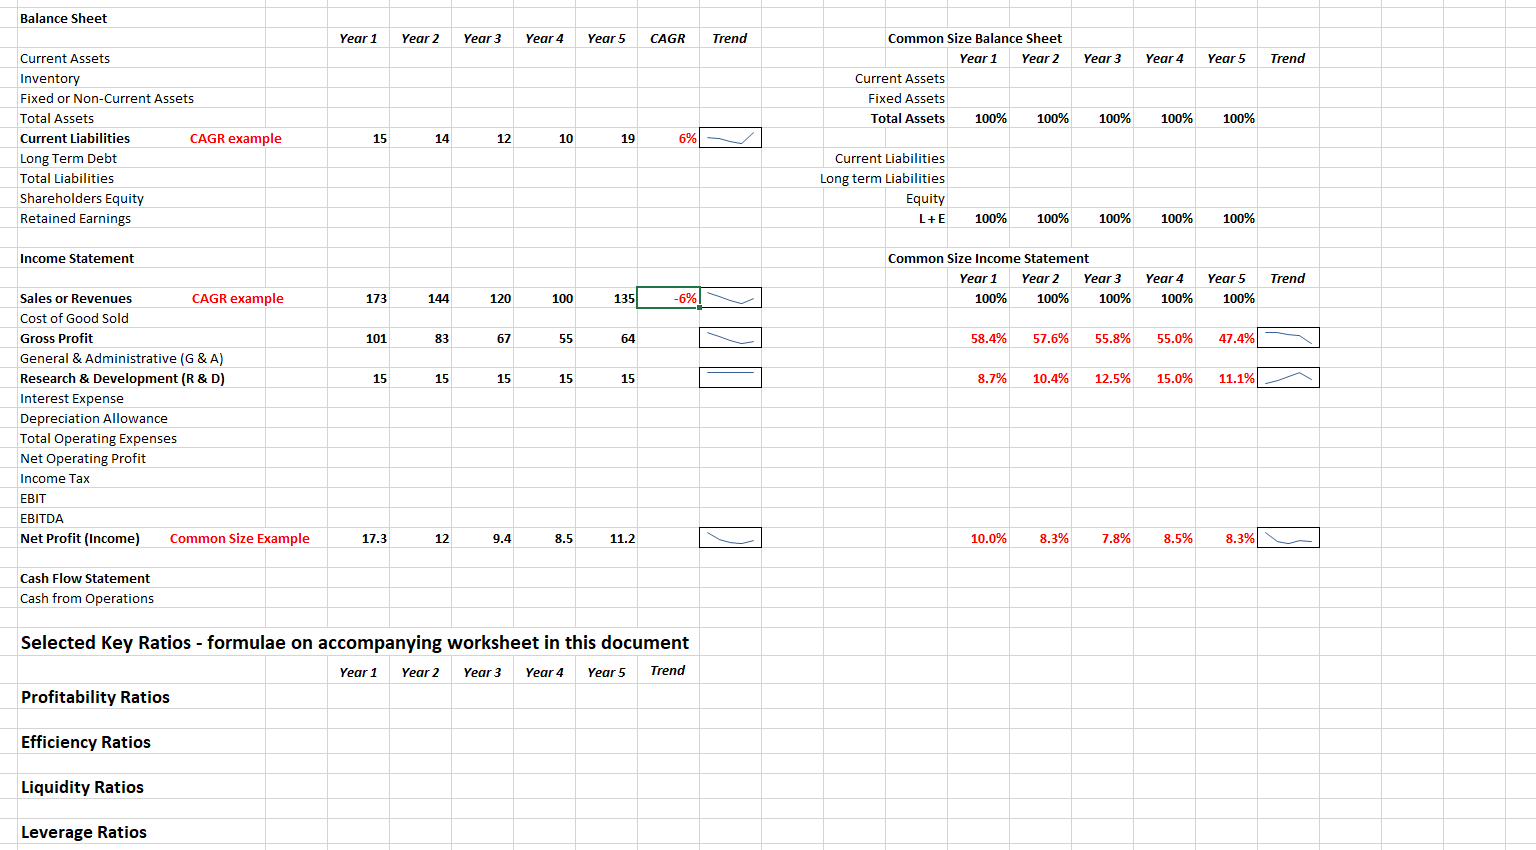
EXHIBIT7 Samsung Electronics Corp. Summary Financial Data, 1970-2016 Source: Morningstar.com; Samsung Annual Reports. In millions of dollars: 1995 2000 2005 2010 2013 2014 2015 Net Sales $20,917 $27,230 $56,720 $135,771 $207,902 $195,883 $203,302 Cost of Sales $12,122 $17,469 $39,642 $90,145 $125,178 SG&A $3,262 $3,856 $9,121 $23,042 $19,372 $22,404 $23,128 R&D Expenses $3,137* $1,596 $5,434 $7,990 $13,018 $13,561 $13,887 Advertising Expenses $3,398 $4,080 $3,557 $3,903 Cost of Sales $121,857 $125,112 As a % of Net Sales 62.2% 61.5% Income before tax $3,884 $6,434 $8,756 $16,971 $33,441 $26,480 $26,304 Net Income $3,237 $4,777 $7,542 $14,177 $27,110 $22,223 $18,942 As a % of net sales 15.5% 17.5% 13.3% 10.4% 13.0% 11.2% 9.3% Total assets $51,595 $21,362 $49,890 $117,911 $194,614 $203,680 $214,072 Labor Costs $3,491 $16,907 $16,682 $18,609 Employees 96,898 Employees overseas Exchange Rate 1.035 0.9795 0.9427 1.0132 *Reported as 15% of total sales for 1995 Balance Sheet Year 1 Year 2 Year 3 Year 4 Year 5 CAGR Trend Year 3 Year 4 Year 5 Trend Common Size Balance Sheet Year 1 Year 2 Current Assets Fixed Assets Total Assets 100% 100% 100% 100% 100% Current Assets Inventory Fixed or Non-Current Assets Total Assets Current Liabilities CAGR example Long Term Debt Total Liabilities Shareholders Equity Retained Earnings 15 14 12 10 19 6% 6 Current Liabilities Long term Liabilities Equity L+E 100% 100% 100% 100% 100% Income Statement Common Size Income Statement Year 1 Year 2 Year 3 100% 100% 100% Year 5 Trend Year 4 100% 173 144 120 100 135 -6% 100% 101 83 67 55 64 58.4% 57.6% 55.8% 55.0% 47.4% 15 15 15 15 15 8.7% 10.4% 12.5% 15.0% 11.1% Sales or Revenues CAGR example Cost of Good Sold Gross Profit General & Administrative (G&A) Research & Development (R&D) Interest Expense Depreciation Allowance Total Operating Expenses Net Operating Profit Income Tax EBIT EBITDA Net Profit (Income) Common Size Example 17.3 12 9.4 8.5 11.2 10.0% 8.3% 7.8% 8.5% 8.3%) Cash Flow Statement Cash from Operations Selected Key Ratios - formulae on accompanying worksheet in this document Year 1 Year 2 Trend Profitability Ratios Year 3 Year 4 Year 5 Efficiency Ratios Liquidity Ratios Leverage Ratios EXHIBIT7 Samsung Electronics Corp. Summary Financial Data, 1970-2016 Source: Morningstar.com; Samsung Annual Reports. In millions of dollars: 1995 2000 2005 2010 2013 2014 2015 Net Sales $20,917 $27,230 $56,720 $135,771 $207,902 $195,883 $203,302 Cost of Sales $12,122 $17,469 $39,642 $90,145 $125,178 SG&A $3,262 $3,856 $9,121 $23,042 $19,372 $22,404 $23,128 R&D Expenses $3,137* $1,596 $5,434 $7,990 $13,018 $13,561 $13,887 Advertising Expenses $3,398 $4,080 $3,557 $3,903 Cost of Sales $121,857 $125,112 As a % of Net Sales 62.2% 61.5% Income before tax $3,884 $6,434 $8,756 $16,971 $33,441 $26,480 $26,304 Net Income $3,237 $4,777 $7,542 $14,177 $27,110 $22,223 $18,942 As a % of net sales 15.5% 17.5% 13.3% 10.4% 13.0% 11.2% 9.3% Total assets $51,595 $21,362 $49,890 $117,911 $194,614 $203,680 $214,072 Labor Costs $3,491 $16,907 $16,682 $18,609 Employees 96,898 Employees overseas Exchange Rate 1.035 0.9795 0.9427 1.0132 *Reported as 15% of total sales for 1995 Balance Sheet Year 1 Year 2 Year 3 Year 4 Year 5 CAGR Trend Year 3 Year 4 Year 5 Trend Common Size Balance Sheet Year 1 Year 2 Current Assets Fixed Assets Total Assets 100% 100% 100% 100% 100% Current Assets Inventory Fixed or Non-Current Assets Total Assets Current Liabilities CAGR example Long Term Debt Total Liabilities Shareholders Equity Retained Earnings 15 14 12 10 19 6% 6 Current Liabilities Long term Liabilities Equity L+E 100% 100% 100% 100% 100% Income Statement Common Size Income Statement Year 1 Year 2 Year 3 100% 100% 100% Year 5 Trend Year 4 100% 173 144 120 100 135 -6% 100% 101 83 67 55 64 58.4% 57.6% 55.8% 55.0% 47.4% 15 15 15 15 15 8.7% 10.4% 12.5% 15.0% 11.1% Sales or Revenues CAGR example Cost of Good Sold Gross Profit General & Administrative (G&A) Research & Development (R&D) Interest Expense Depreciation Allowance Total Operating Expenses Net Operating Profit Income Tax EBIT EBITDA Net Profit (Income) Common Size Example 17.3 12 9.4 8.5 11.2 10.0% 8.3% 7.8% 8.5% 8.3%) Cash Flow Statement Cash from Operations Selected Key Ratios - formulae on accompanying worksheet in this document Year 1 Year 2 Trend Profitability Ratios Year 3 Year 4 Year 5 Efficiency Ratios Liquidity Ratios Leverage Ratios
Step by Step Solution
There are 3 Steps involved in it

Get step-by-step solutions from verified subject matter experts