

Question: Financial information for American Eagle is presented in Appendix A. Required: 1-a. Calculate the debt to equity ratio for the past two years. (Round your
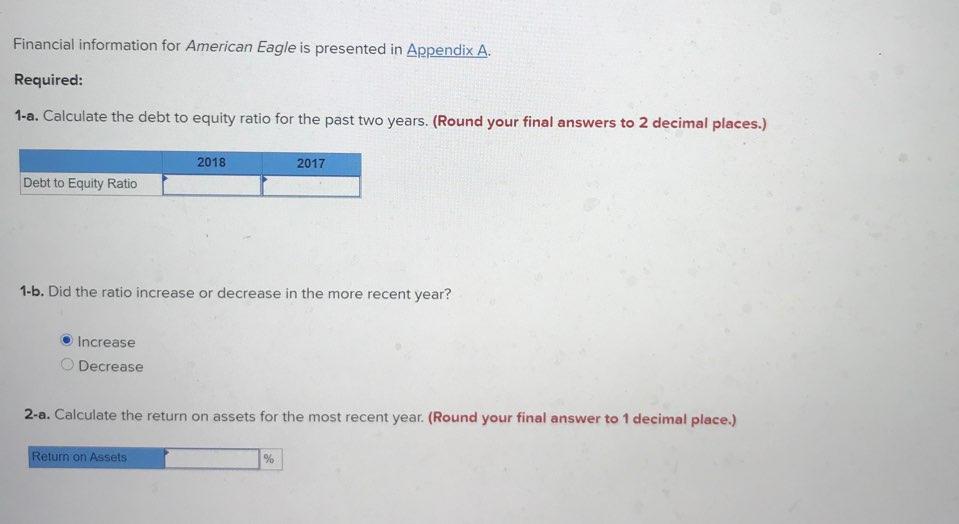
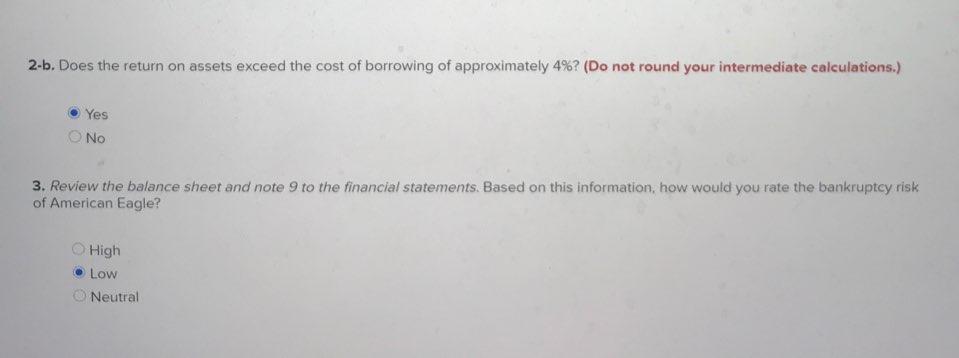
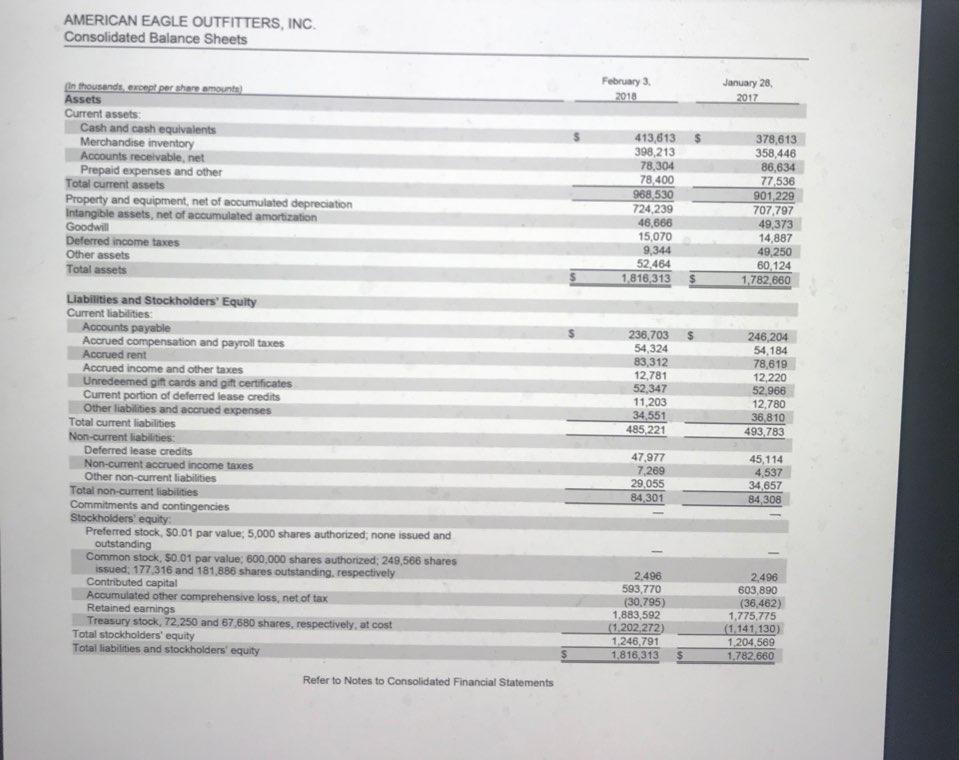
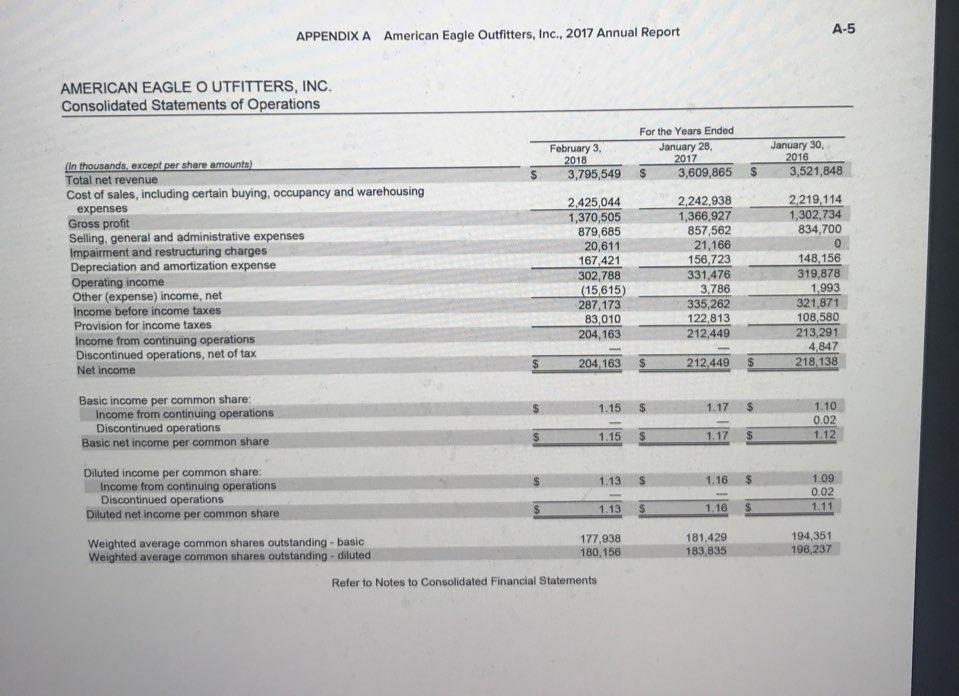
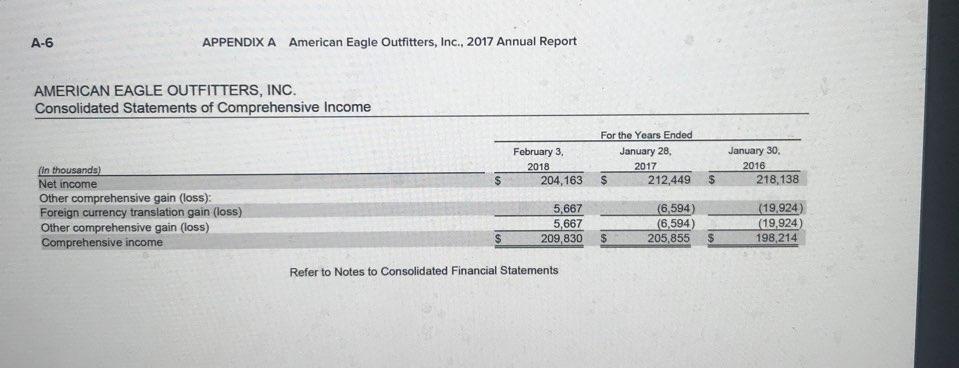
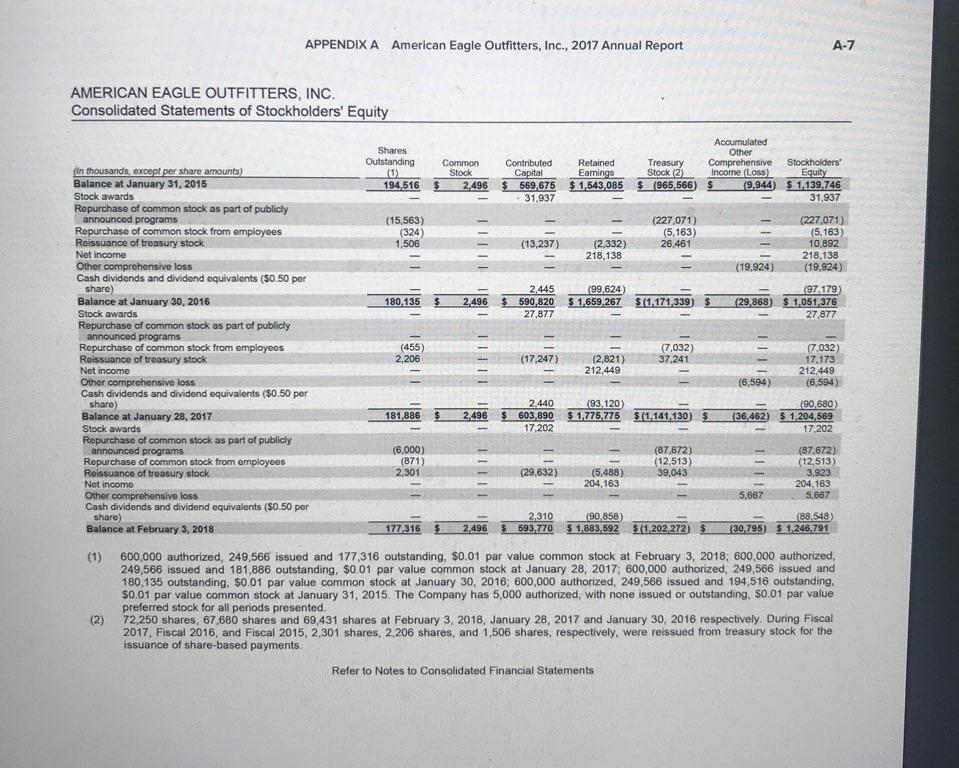
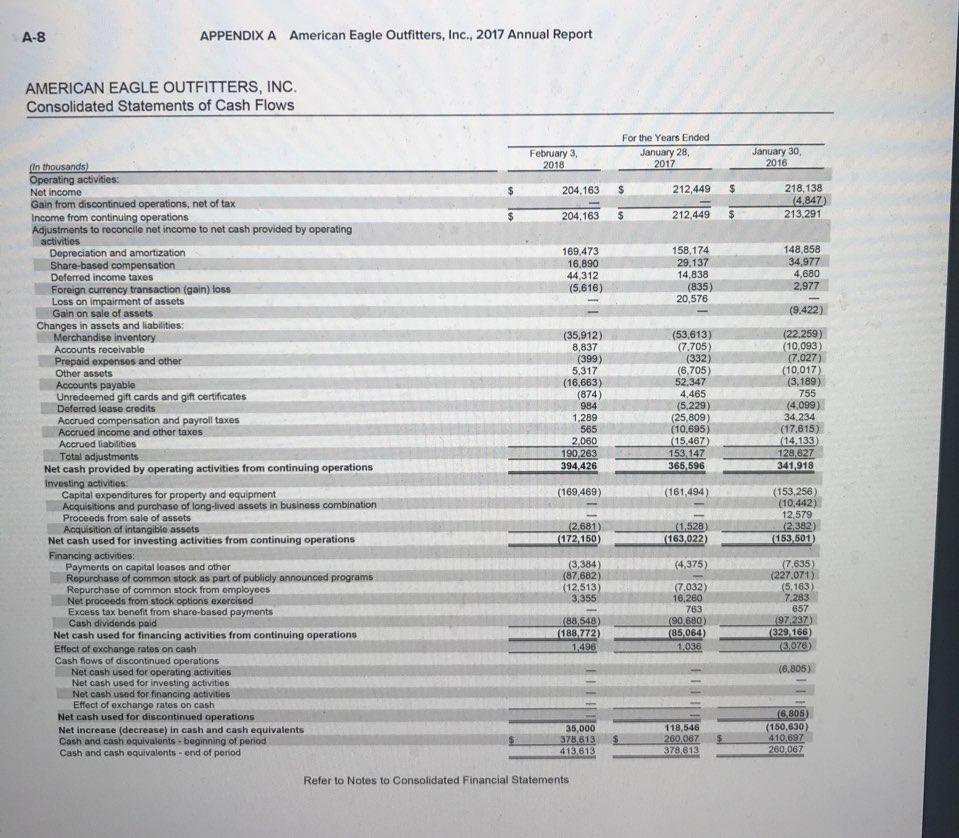
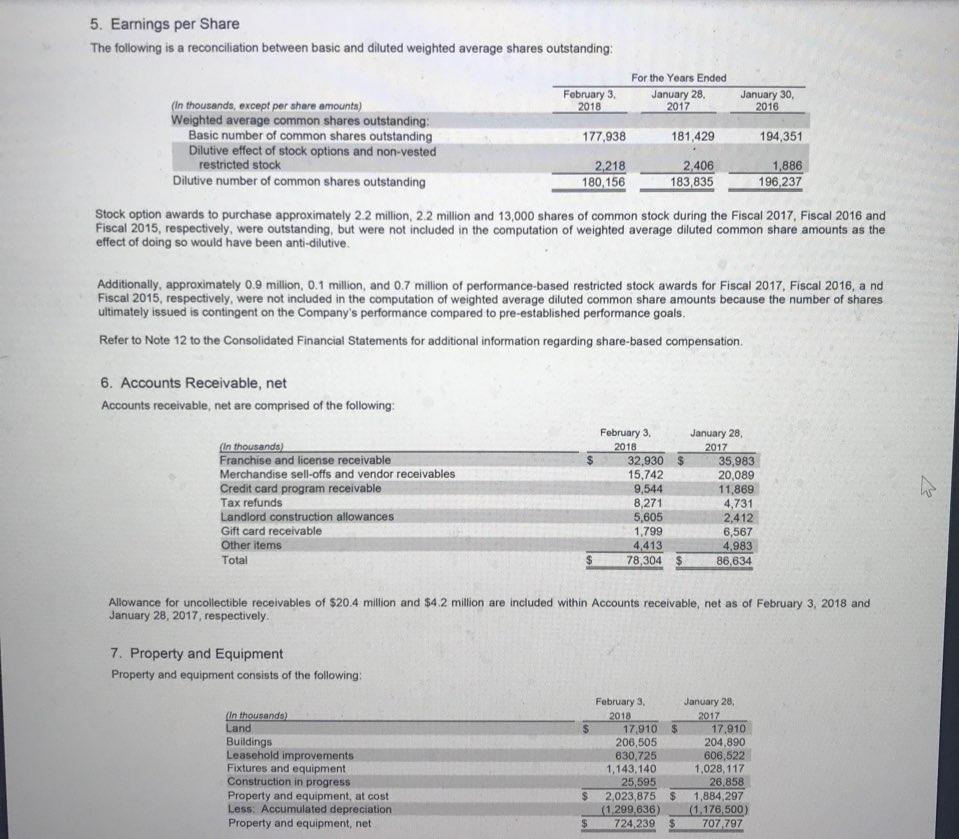
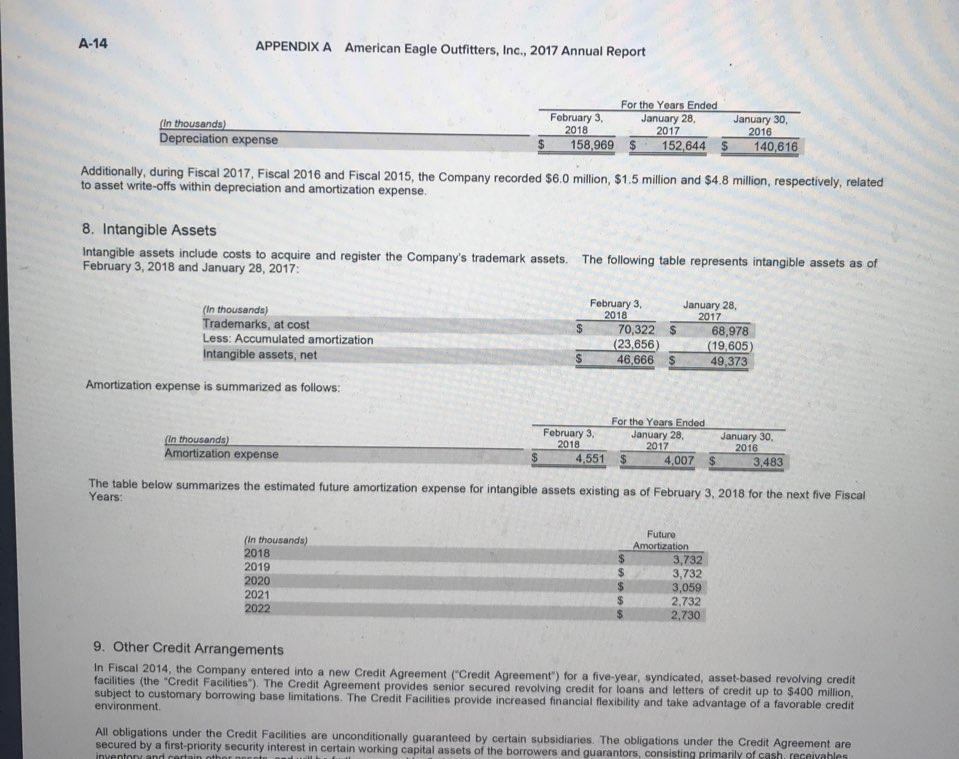
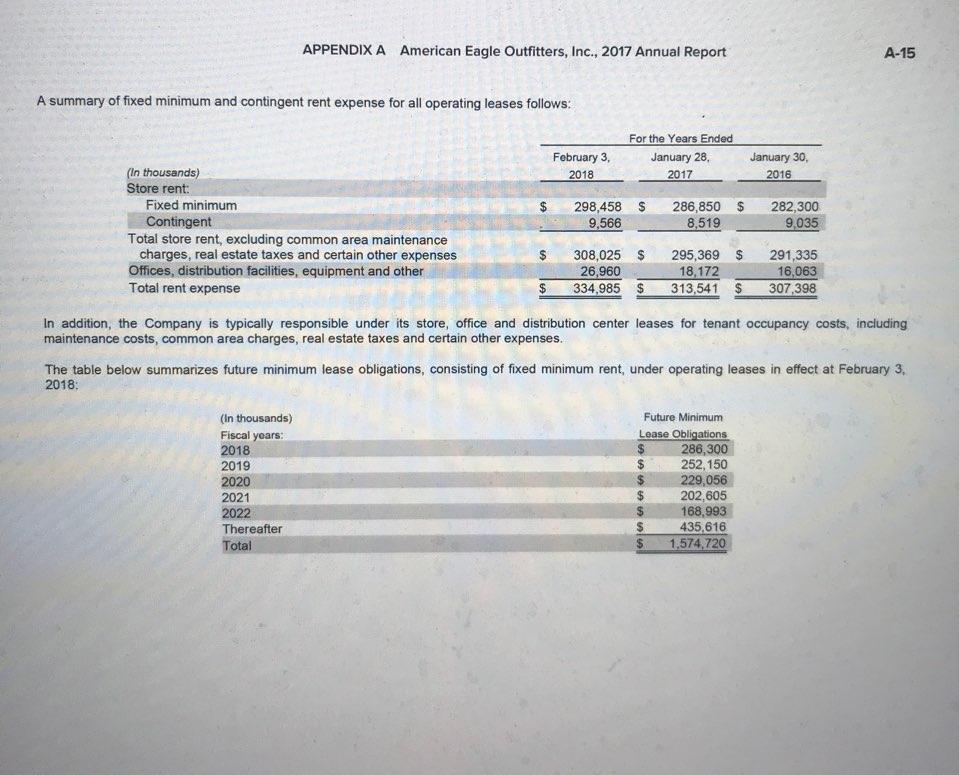
Financial information for American Eagle is presented in Appendix A. Required: 1-a. Calculate the debt to equity ratio for the past two years. (Round your final answers to 2 decimal places.) 2018 2017 Debt to Equity Ratio 1-b. Did the ratio increase or decrease in the more recent year? Increase Decrease 2-a. Calculate the return on assets for the most recent year. (Round your final answer to 1 decimal place.) Retum on Assets 2-b. Does the return on assets exceed the cost of borrowing of approximately 4%? (Do not round your intermediate calculations.) Yes No 3. Review the balance sheet and note 9 to the financial statements. Based on this information, how would you rate the bankruptcy risk of American Eagle? High Low Neutral AMERICAN EAGLE OUTFITTERS, INC. Consolidated Balance Sheets February 3 2018 January 28, 2017 Assets 413,613 398,213 78,304 78.400 968.530 724,239 46,666 15,070 9,344 52.464 1.816,313 378,613 358,446 86,634 77,536 901 229 707797 49,373 14,887 49,250 60,124 1,782 660 Current assets Cash and cash equivalents Merchandise inventory Accounts receivable, net Prepaid expenses and other Total current assets Property and equipment, net of accumulated depreciation Intangible assets, net of accumulated amortization Goodwill Deferred income taxes Other assets Total assets Liabilities and Stockholders' Equity Current liabilities Accounts payable Accrued compensation and payroll taxes Accrued rent Accrued income and other taxes Unredeemed gift cards and gift certificates Current portion of deferred lease credits Other liabilities and accrued expenses Total current liabilities Non-current liabilities: Deferred lease credits Non-current accrued income taxes Other non-current liabilities Total non-current liabilities Commitments and contingencies Stockholders' equity: Preferred stock, 30.01 par value; 5,000 shares authorized, none issued and outstanding Common stock, 30.01 par value, 600.000 shares authorized; 249,566 shares issued: 177 316 and 181.886 shares outstanding, respectively Contributed capital Accumulated other comprehensive loss, net of tax Retained earnings Treasury stock, 72,250 and 67.680 shares, respectively, at cost Total stockholders' equity Total liabilities and stockholders' equity 238.703 54,324 83,312 12,781 52,347 11,203 34,551 485 221 246 204 54,184 78,619 12,220 52.968 12,780 36 810 493.783 47,977 7,269 29,055 84 301 45,114 4,537 34,657 84,308 2,496 593.770 (30.795) 1,883,592 (1.202.272) 1.246,791 1,816,313 2,496 603,890 (36.462) 1,775,775 (1 141 130) 1 204,589 1,782,660 $ Refer to Notes to Consolidated Financial Statements A-5 APPENDIX A American Eagle Outfitters, Inc., 2017 Annual Report AMERICAN EAGLE OUTFITTERS, INC. Consolidated Statements of Operations February 3, 2018 3,795,549 For the Years Ended January 28, 2017 S 3,609,865 January 30, 2016 3,521,848 2,219,114 1,302,734 834,700 (In thousands, except per share amounts). Total net revenue Cost of sales, including certain buying, occupancy and warehousing expenses Gross profit Selling, general and administrative expenses Impairment and restructuring charges Depreciation and amortization expense Operating income Other (expense) income, net Income before income taxes Provision for income taxes Income from continuing operations Discontinued operations, net of tax Net income 2,425,044 1,370,505 879,685 20,611 167,421 302,788 (15,615) 287.173 83,010 204,163 2,242.938 1,366,927 857,562 21,166 156 723 331,476 3,786 335,262 122,813 212,449 148,156 319,878 1,993 321,871 108,580 213,291 4,847 218,138 204 163 $ 212,449 $ 1.15 $ 1.17 1.10 0.02 1.12 1.15 $ 1.17 $ Basic income per common share: Income from continuing operations Discontinued operations Basic net income per common share Diluted income per common share: Income from continuing operations Discontinued operations Diluted net income per common share 1.13 $ 1.16 $ 1.09 0.02 1.11 1.13 $ 1.16 $ 181,429 183 835 194,351 198,237 Weighted average common shares outstanding - basic 177,938 Weighted average common shares outstanding - diluted 180, 156 Refer to Notes to Consolidated Financial Statements A-6 APPENDIX A American Eagle Outfitters, Inc., 2017 Annual Report AMERICAN EAGLE OUTFITTERS, INC. Consolidated Statements of Comprehensive Income February 3 2018 204,163 For the Years Ended January 28, 2017 212,449 January 30 2016 218,138 $ $ (in thousands) Net income Other comprehensive gain (loss): Foreign currency translation gain (loss) Other comprehensive gain (loss) Comprehensive income 5,667 5,667 209,830 (6,594) (6,594) 205,855 (19.924 (19,924) 198,214 $ $ Refer to Notes to Consolidated Financial Statements APPENDIX A American Eagle Outfitters, Inc., 2017 Annual Report A-7 AMERICAN EAGLE OUTFITTERS, INC. Consolidated Statements of Stockholders' Equity Shares Outstanding 0 194,516 Common Stock 2.496 Contributed Retained Capital Eamings $ 569,675 $ 1,543,085 31,937 Treasury Stock (2) $ (966,566) Accumulated Other Comprehensive Stockholders Income (Loss) Equity (9.944) $ 1,139,746 31,937 (15,563) (324) 1,506 IIIII (227,071) (5.163) 26.461 (13,237) (2.332) 218,138 (227,071) (5,163) 10,892 218,138 (19.924) (19.924) 180,135 2,445 $ 590,820 27,877 (99,624) $1,659 267 2,496 $11.171 339) $ 197 179) (29,868) $ 1,051,376 27,877 (in thousands except per share amounts) Balance at January 31, 2015 Stock awards Repurchase of common stock as part of publicly announced programs Repurchase of common stock from employees Reissuance of treasury stock Net income Other comprehensive loss Cash dividends and dividend equivalents (50.50 per share) Balance at January 30, 2016 Stock awards Repurchase of common stock as part of publicly announced programs Repurchase of common stock from employees Reissuance of treasury stock Net income Other comprehensive loss Cash dividends and dividend equivalents ($0.50 per share) Balance at January 28, 2017 Stock awards Repurchase of common stock as part of publicly announced programs Repurchase of common stock from employees Reissuance of treasury stock Net incomo Other comprehensive loss Cash dividends and dividend equivalents (50.50 per share) Balance at February 3, 2018 (455) 2,206 (7,032) 37,241 (17,247) (2,821) 212,449 7,032) 17.173 212 449 (6,594) (6,594) (93,120) $ 1,775,775 181,886 2,440 603,890 17,202 2.496 $11. 141 130) $ (36,462 (90.680) $ 1,204,569 17,202 (6.000) (871) 2.301 (87,672) (12,513) 39,043 (29,632) (5.488) 204,163 (87.672) (12,513) 3,923 204.163 5.667 5,867 177,316 $ 2.496 2,310 593.770 (90.858) $ 1,883,592 $ (1 202 272) $ 30 795) (88,548) $ 1,246 791 (1) (2) 600,000 authorized, 249,566 issued and 177,316 outstanding, $0.01 par value common stock at February 3, 2018, 600,000 authorized, 249,566 issued and 181,886 outstanding, $0.01 par value common stock at January 28, 2017. 600,000 authorized, 249,566 issued and 180,135 outstanding, $0.01 par value common stock at January 30, 2016, 600,000 authorized, 249,566 issued and 194,516 outstanding, $0.01 par value common stock at January 31, 2015. The Company has 5,000 authorized, with none issued or outstanding, $0.01 par value preferred stock for all periods presented 72.250 shares, 67,680 shares and 69,431 shares at February 3, 2018, January 28, 2017 and January 30, 2016 respectively. During Fiscal 2017, Fiscal 2016, and Fiscal 2015, 2,301 shares, 2,206 shares, and 1,506 shares, respectively, were reissued from treasury stock for the issuance of share-based payments Refer to Notes to Consolidated Financial Statements A-8 APPENDIX A American Eagle Outfitters, Inc., 2017 Annual Report AMERICAN EAGLE OUTFITTERS, INC. Consolidated Statements of Cash Flows February 3, 2018 For the Years Ended January 28, 2017 January 30, 2016 204,163 $ 212,449 $ 218,138 (4,847) 213,291 204,163 212,449 169,473 16,890 44 312 (5.616) 158,174 29,137 14,838 (835) 20,576 148,858 34,977 4,680 2.977 (9.422) (In thousands) Operating activities: Not income Gain from discontinued operations, net of tax Income from continuing operations Adjustments to reconcile net income to net cash provided by operating activities Depreciation and amortization Share-based compensation Deferred income taxes Foreign currency transaction (gain) foss Loss on impairment of assets Gain on sale of assets Changes in assets and liabilities: Merchandise inventory Accounts receivable Prepaid expenses and other Other assets Accounts payable Unredeemed gift cards and gift certificates Deferred lease credits Accrued compensation and payroll taxes Accrued income and other taxes Accrued liabilities Total adjustments Net cash provided by operating activities from continuing operations Investing activities: Capital expenditures for property and equipment Acquisitions and purchase of long-lived assets in business combination Proceeds from sale of assets Acquisition of intangible assets Net cash used for investing activities from continuing operations Financing activities: Payments on capital leases and other Ropurchase of common stock as part of publicly announced programs Repurchase of common stock from employees Net proceeds from stock options exercised Excess tax benefit from share-based payments Cash dividends paid Net cash used for financing activities from continuing operations Effect of exchange rates on cash Cash flows of discontinued operations Net cash used for operating activities Net cash used for investing activities Net cash used for financing activities Effect of exchange rates on cash Net cash used for discontinued operations Net increase (decrease) in cash and cash equivalents Cash and cash oquivalents beginning of period Cash and cash equivalents - end of period (35,912) 8,837 (399) 5,317 (16,663) (874) 984 1.289 565 2,060 190 283 394,426 (53,613) (7.705) (332) (6.705) 52.347 4,465 (5,229) (25,809 (10,695) (15,467) 153,147 365,596 (22,259) (10,093 (7.027) (10.017) (3.189) 755 (4.099 34,234 (17.615) (14,133 128,827 341,918 (169,469) (161.494) (153,256) (10,442) 12.579 (2.382) (153 501) (2,681) (172 150 (1,528 (163 022) (4,375) (3,384) (87.682) (12,513) 3,355 (7,635) (227.071) (5,163) 7.283 657 (97/237 (329 166 (3.078 (7,032) 16,260 763 (90.680 (85 064) 1,036 (88,548) (188,772) 1,496 (6.805) 35,000 378 813 413.813 118,546 260.067 378,613 (6.805 (150,630 410,697 280,067 $ Refer to Notes to Consolidated Financial Statements January 30, 2016 5. Earnings per Share The following is a reconciliation between basic and diluted weighted average shares outstanding: For the Years Ended February 3, January 28, (In thousands, except per share amounts) 2018 2017 Weighted average common shares outstanding Basic number of common shares outstanding 177,938 181,429 194,351 Dilutive effect of stock options and non-vested restricted stock 2,218 2.406 1,886 Dilutive number of common shares outstanding 180.156 183,835 196,237 Stock option awards to purchase approximately 2.2 million, 22 million and 13,000 shares of common stock during the Fiscal 2017, Fiscal 2016 and Fiscal 2015, respectively, were outstanding, but were not included in the computation of weighted average diluted common share amounts as the effect of doing so would have been anti-dilutive Additionally, approximately 0.9 million, 0.1 million, and 0.7 million of performance-based restricted stock awards for Fiscal 2017, Fiscal 2016, a nd Fiscal 2015, respectively, were not included in the computation of weighted average diluted common share amounts because the number of shares ultimately issued is contingent on the Company's performance compared to pre-established performance goals. Refer to Note 12 to the Consolidated Financial Statements for additional information regarding share-based compensation 6. Accounts Receivable, net Accounts receivable, net are comprised of the following: (in thousands) Franchise and license receivable Merchandise sell-offs and vendor receivables Credit card program receivable Tax refunds Landlord construction allowances Gift card receivable Other items Total February 3 2018 32,930 $ 15,742 9,544 8,271 5,605 1,799 4,413 78,304 January 28, 2017 35,983 20,089 11,869 4,731 2,412 6,567 4,983 86,634 Allowance for uncollectible receivables of $20.4 million and $4.2 million are included within Accounts receivable, net as of February 3, 2018 and January 28, 2017, respectively. 7. Property and Equipment Property and equipment consists of the following: $ in thousands Land Buildings Leasehold improvements Fixtures and equipment Construction in progress Property and equipment, at cost Less: Accumulated depreciation Property and equipment, net February 3, 2018 17,910 206,505 630,725 1,143, 140 25,595 2,023,875 (1 299,636 724,239 January 28, 2017 17,910 204.890 606,522 1,028, 117 26.858 1,884,297 (1.176,500) 707 797 $ $ $ A-14 APPENDIX A American Eagle Outfitters, Inc., 2017 Annual Report 2018 2016 For the Years Ended February 3. January 28, January 30, (In thousands) 2017 Depreciation expense 158,969 $ 152,644 5 140,616 Additionally, during Fiscal 2017, Fiscal 2016 and Fiscal 2015, the Company recorded $6.0 million, $1.5 million and $4.8 million, respectively, related to asset write-offs within depreciation and amortization expense. 8. Intangible Assets Intangible assets include costs to acquire and register the Company's trademark assets. February 3, 2018 and January 28, 2017 The following table represents intangible assets as of $ (In thousands) Trademarks, at cost Less: Accumulated amortization Intangible assets, net Amortization expense is summarized as follows: February 3, January 28, 2018 2017 70,322 $ 68,978 (23,656) (19,605 46,666 $ 49,373 $ Yin thousands) Amortization expense For the Years Ended February 3 January 28, January 30, 2018 2017 2016 4,551 $ 4,007 $ 3,483 The table below summarizes the estimated future amortization expense for intangible assets existing as of February 3, 2018 for the next five Fiscal Years: (in thousands) 2018 2019 2020 2021 2022 66 66 Futuro Amortization $ 3,732 $ 3,732 3,059 2,732 2,730 9. Other Credit Arrangements In Fiscal 2014, the Company entered into a new Credit Agreement ("Credit Agreement") for a five-year, syndicated, asset-based revolving credit facilities (the "Credit Facilities"). The Credit Agreement provides senior secured revolving credit for loans and letters of credit up to $400 million, subject to customary borrowing base limitations. The Credit Facilities provide increased financial flexibility and take advantage of a favorable credit environment All obligations under the Credit Facilities are unconditionally guaranteed by certain subsidiaries. The obligations under the Credit Agreement are secured by a first-priority security interest in certain working capital assets of the borrowers and guarantors, consisting primarily of cash receivables inventandartin APPENDIX A American Eagle Outfitters, Inc., 2017 Annual Report A-15 A summary of fixed minimum and contingent rent expense for all operating leases follows: February 3, 2018 For the Years Ended January 28, 2017 January 30, 2016 $ $ (In thousands) Store rent: Fixed minimum Contingent Total store rent, excluding common area maintenance charges, real estate taxes and certain other expenses Offices, distribution facilities, equipment and other Total rent expense 298,458 $ 9,566 286,850 8,519 282,300 9,035 $ 308,025 $ 26,960 334,985 $ 295,369 $ 18,172 313,541 $ 291,335 16,063 307,398 $ In addition, the Company is typically responsible under its store, office and distribution center leases for tenant occupancy costs, including maintenance costs, common area charges, real estate taxes and certain other expenses. The table below summarizes future minimum lease obligations, consisting of fixed minimum rent, under operating leases in effect at February 3, 2018: (In thousands) Fiscal years: 2018 2019 2020 2021 2022 Thereafter Total Future Minimum Lease Obligations 286,300 252,150 229,056 202,605 $ 168,993 435,616 1,574, 720
Step by Step Solution
There are 3 Steps involved in it

Get step-by-step solutions from verified subject matter experts