

Question: financial mathematics, please using Matlab thanks a lot ! The datafile is here https://www.dropbox.com/s/iirihvcbeekjh70/Data%20file%20%5BEdited_%2006_10_17%5D%20-%20Dow_2004_2010.csv?dl=0 In this assignment you will be analyzing real stock market data
financial mathematics, please using Matlab thanks a lot ! The datafile is here https://www.dropbox.com/s/iirihvcbeekjh70/Data%20file%20%5BEdited_%2006_10_17%5D%20-%20Dow_2004_2010.csv?dl=0
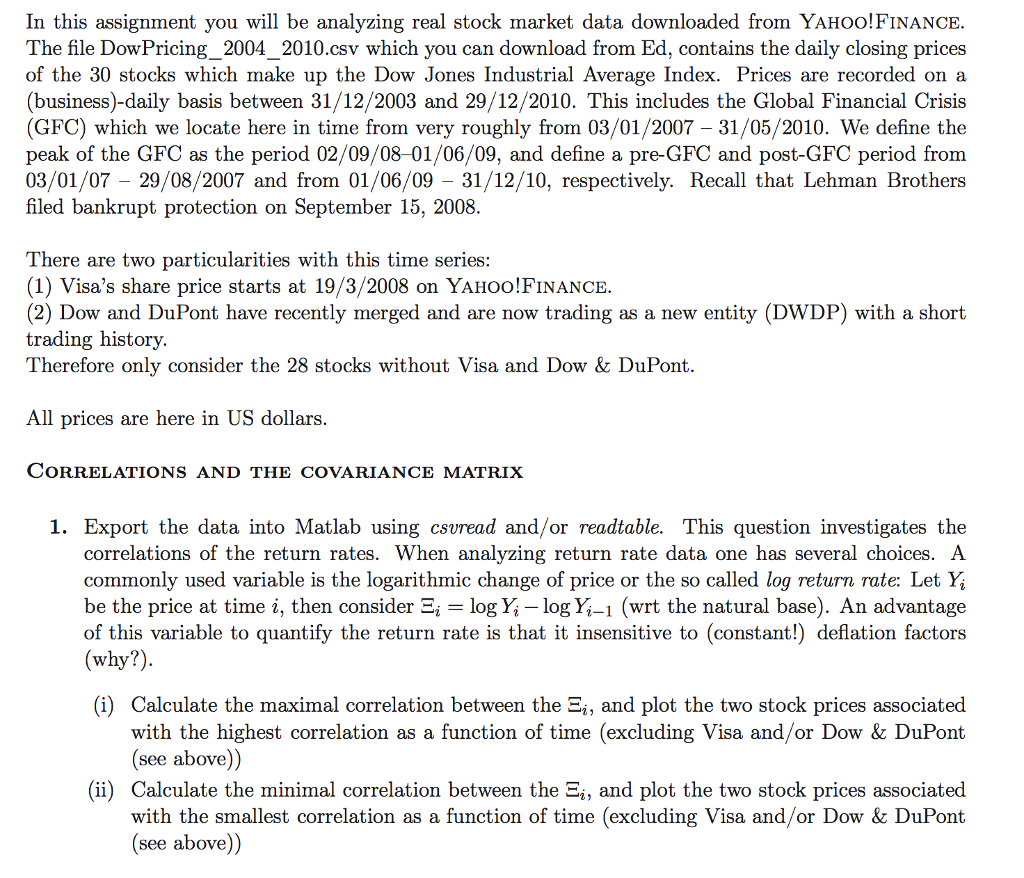
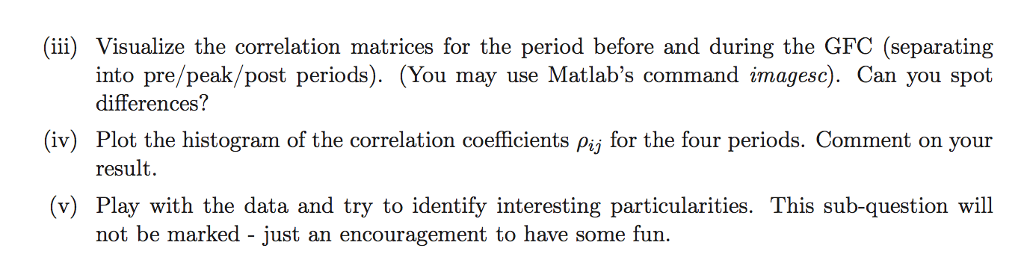
In this assignment you will be analyzing real stock market data downloaded from YAHoo!FinANCE. The file DowPricing_2004_2010.csv which you can download from Ed, contains the daily closing prices of the 30 stocks which make up the Dow Jones Industrial Average Index. Prices are recorded on a (business)-daily basis between 31/12/2003 and 29/12/2010. This includes the Global Financial Crisis (GFC) which we locate here in time from very roughly from 03/01/2007 - 31/05/2010. We define the peak of the GFC as the period 02/09/08 01/06/09, and define a pre-GFC and post-GFC period from 03/01/07 - 29/08/2007 and from 01/06/09 - 31/12/10, respectively. Recall that Lehman Brothers filed bankrupt protection on September 15, 2008 There are two particularities with this time series: (1) Visa's share price starts at 19/3/2008 on YAHoo!FinancCE. (2) Dow and DuPont have recently merged and are now trading as a new entity (DWDP) with a short trading history. Therefore only consider the 28 stocks without Visa and Dow & DuPont. All prices are here in US dollar:s CorRELATIONS AND THE COVARIANCE MATRIX 1. Export the data into Matlab using csvread and/or readtable. This question investigates the correlations of the return rates. When analyzing return rate data one has several choices. A commonly used variable is the logarithmic change of price or the so called log return Tate: Let Y be the price at time i, then considers,-log Yi-log Yi-1 (wrt the natural base). An advantage of this variable to quantify the return rate is that it insensitive to (constant!) deflation factors (why?) (i) Calculate the maximal correlation between the Ei, and plot the two stock prices associated with the highest correlation as a function of time (excluding Visa and/or Dow & DuPont see above (ii) Calculate the minimal correlation between the and plot the two stock prices associated with the smallest correlation as a function of time (excluding Visa and/or Dow & DuPont see above
Step by Step Solution
There are 3 Steps involved in it

Get step-by-step solutions from verified subject matter experts