

Question: Financial Reporting Problem BYP13-1 The shareholders' equity section for Corus Entertain- ment Inc. is shown in the consolidated balance sheet in Appendix A. You will
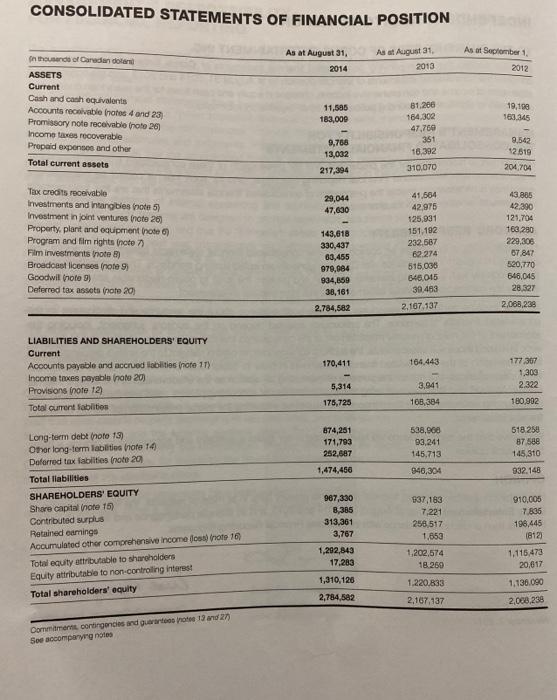
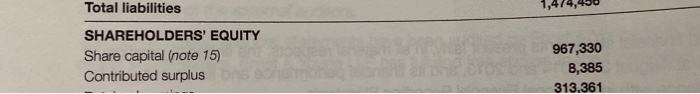
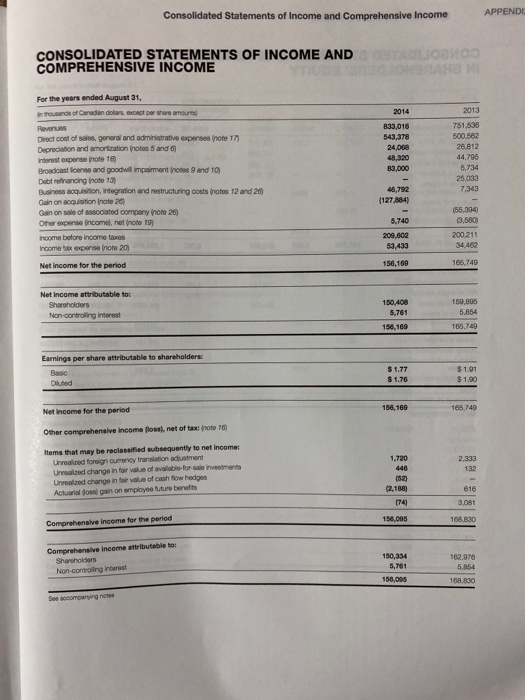
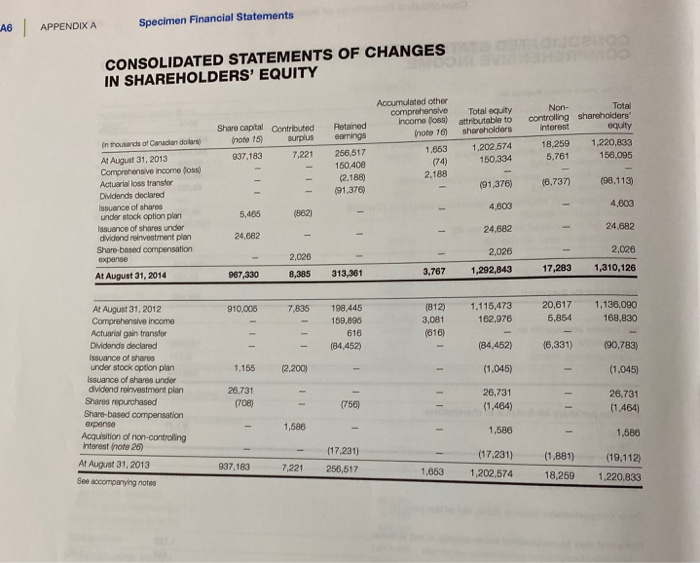
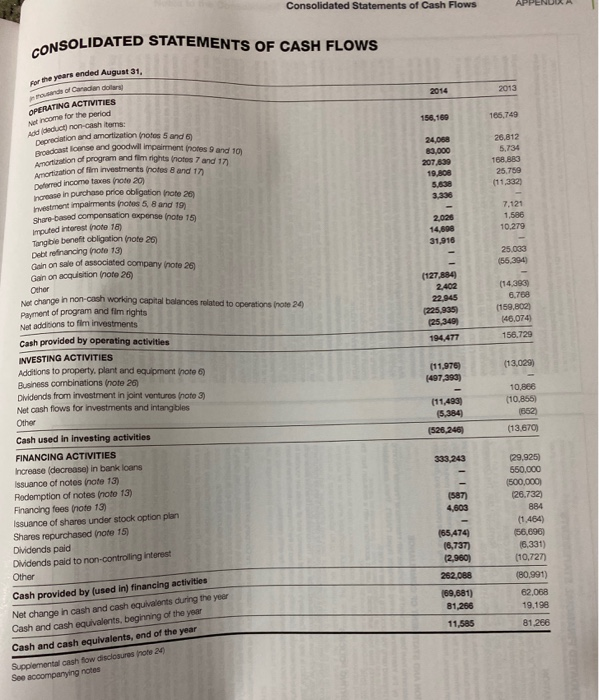
Financial Reporting Problem BYP13-1 The shareholders' equity section for Corus Entertain- ment Inc. is shown in the consolidated balance sheet in Appendix A. You will also find data related to this problem in the notes to the financial statements. Instructions (a) How many classes of shares does Corus have? For each class of shares, specify how many shares are authorized and issued at August 31, 2014. (Hint: Refer to Note 15.) (b) Refer to Note 15 again. What are the rights of each class of shares (c) Did Corus issue any additional shares in fiscal 2014? If so, specify how many were issued, for what dollar amount, and for what purpose. (d) What was the average per share amount of each class of Corus's shares at the end of fiscal 2014? (e) Did Corus declare any cash dividends in fiscal 2014? If yes, how much? Corus's return on equity was calculated for fiscal 2014 in Illus- tration 13-8. Calculate the company's return on equity for fiscal 2013. Did this ratio improve or worsen from 2013 to 2014? (f) CONSOLIDATED STATEMENTS OF FINANCIAL POSITION As at September 1 As at August 31, 2014 As at August 31. 2013 2012 in thousands of Canadian dollars ASSETS Current Cash and cash equivalents Accounts receivable (notos 4 and 23) Promissory note receivable (note 26) Income taxes recoverable Propaid expenses and other Total current assets 11,585 183,009 19,108 163.345 61,286 164, 302 47,759 351 16,392 310.070 9,768 13.002 9,542 12.619 204,704 217,394 29,044 47,630 Tax credits receivable Investments and intangibles (note 5) Investment in joint ventures (note 26) Property, plant and equipment (note) Program and film rights (note 7 Film Investments note 8) Broadcast licenses (note 9) Goodwil note 9) Deferred tax assots (note 20) 143,618 330,437 63,455 979,984 934,859 38,161 2,784,582 41.554 42.975 125.931 151.192 232.587 62 274 515 038 646.045 39483 43,885 42.390 121,704 163,280 229,305 87 847 520,770 646,045 28.327 2,167,137 2,068,238 170,411 164.443 LIABILITIES AND SHAREHOLDERS' EQUITY Current Accounts payable and accrued abilities (note 11) Income taxes payable (note 20) Provisions (note 12) Total current abilities 3.041 5,314 175,725 177,367 1,303 2.322 180,992 168,384 874,251 171,793 252,687 538,968 93.241 145,713 518 258 87 588 145.310 1,474,456 940,304 932.148 Long-term debt (note 13) Other long-term labilities Note 14 Doforred tax labilities (note 20 Total liabilities SHAREHOLDERS' EQUITY Share capital (note 15) Contributed surplus Ratained earnings Accumulated other comprehensive Income (oss) (note 16) Total equity attributable to shareholders Equity attributable to non-controlling interest Total shareholders' equity 967,330 8.385 313.361 3,767 937,183 7.221 256,517 1,653 1,202,574 18.250 1.220,833 2,167,137 910,005 7.835 196,445 (812) 1,115,473 20,617 1,292,843 17,283 1,310,126 2.784 582 1,136.090 2,068,238 Commitments, contingencies and guarantos notes 13 and 27 See accompanying notes Total liabilities SHAREHOLDERS' EQUITY Share capital (note 15) Contributed surplus AS 967,330 8,385 313.361 Consolidated Statements of Income and Comprehensive Income APPENDI CONSOLIDATED STATEMENTS OF INCOME AND COMPREHENSIVE INCOME TAJOMOO 2014 2013 833,016 543,378 24,068 For the years ended August 31, in thousands of Canadian dollar per share amoures Revenues Direct cost of sales, general and administrative expenses (note 177 Depreciation and amortization (notes and Interest expense note 18 Broadcast license and goodwill impairment notes 9 and 10 Debt refinancing inate 13 Business acquisition, integration and restructuring costs (notos 12 and 20 Gain on acquisition note 26) Osin on sale of associated company note 20 Other expense incomel, not foto 19) ncome before income taxes Income tax perse note 20 751,536 500 562 26.812 44,795 5,734 25,033 83,000 45.792 (127,884) (55.394 (3,580) 5,740 209,602 53,433 200.211 Net income for the period 156,169 165,749 Net Income attributable to: Shareholders Non-controlling interest 150,408 5,761 156,109 150,895 5,854 168,749 Earnings per share attributable to shareholders Bic $ 1.77 $ 1.76 Dluned Net Income for the period 156,160 165.749 Other comprehensive income foss), net of tax: (note 16 1.720 2,333 Items that may be reclassified subsequently to net income: Unrealed foreign currency translation adustment United change in fair value of available for sale investments Unrealized change in fair value of cash fowledges Actuarial loss gain on employee future benefits 132 2.188) (74) 3.081 156,095 16530 Comprehensive Income for the period Comprehensive Income attributable to: Shareholders Non-controlling interest 169,976 150,034 5,761 150,005 168.830 See accompanying notes A6 APPENDIX A Specimen Financial Statements CONSOLIDATED STATEMENTS OF CHANGES IN SHAREHOLDERS' EQUITY Total Share capital Contributed o re 15) Surplus 937,183 7,221 Retained earrings 256,517 150.408 (2,188) (91.376) Accumulated other comprehensive income 088) note 16 1,653 (74) 2.188 Total equity attributable to shareholders 1.202.574 150,334 Non- controlling shareholders interest equity 18,259 1.220,833 5,761 156.095 (91,376) (6.737 (98,113) in thousands of Canadian dol At August 31, 2013 Comprehensive income foss Actuarial loss transfer Dividends declared Issuance of shares under stock option plan Issuance of shares under dividend reinvestment plan Share based compensation expense At August 31, 2014 4,600 4,603 5,465 (862) 24,682 24,682 24,682 2.026 2,026 8,385 2,026 1,292,843 313,361 967,330 3,767 17,283 1,310,126 910.005 7.835 (812) 3,081 (616) 1,115,473 162,976 20,617 6,854 198,445 159.896 616 184,452) 1,136,090 168,830 (84,452) (6,331) (90,783) 1,155 2.200) (1,045) (1,045) At August 31, 2012 Comprehensive Income Actuarial gain transfer Dividends declared Issuance of shares under stock option plan Issuance of shares under dividend roinvestment plan Shares repurchased Share-based compensation Brense Acquisition of non-controlling Interest rate 26) At August 31, 2013 See accompanying notes 26.731 (708) (756) 26.731 (1.464) 26.731 (1.464) 1,586 1,586 1,586 937.183 (17.231) 256,517 7 .221 (17.231) 1,202,574 1,663 (1.881) 18,259 (19,112) 1.220,833 Consolidated Statements of Cash Flows APPENULA NSOLIDATED STATEMENTS OF CASH FLOWS er the years ended August 31. o nde of Canadian dollar OPERATING ACTIVITIES Not income for the period deduct) non-cash items: 156.159 105,749 24,068 3.000 207 899 19 RON 5.838 3.338 20.812 5.734 16. BB3 25.759 (11,332) preciation and amortization (notes 5 and 6 lense and goodwill impairment notes and 1 s ition of program and fim rights fotos 7 and 12 pation of film Investments (notes 8 and 1 Deferred income taxes (note 20) w e in purchase price obligation note 2 mustment impairments notes 5, 8 and 19 chor based compensation expense note 15 imputed interest rate 1) Tangible benefit obligation (note 29 Debt refinancing note 13) Gain on sale of associated company note 20 Gain on acquisition (note 26) Othor w change in non-coch working capital balances related to operations (note 24 Payment of program and fim rights Net addinions to film investments 2.026 14.808 31,916 7,121 1.586 10.279 25.033 (55,394 (127,884 2.402 22.945 225.935 (25,349) 194,477 (14.383) 6.762 (159,802) 146.074 156,729 (13,028) (11,976) (497,393) 10.866 (10,855) 1652 (11,493 (5,384 (526,246) (13,670) Cash provided by operating activities INVESTING ACTIVITIES Additions to property, plant and equipment (note 6) Business combinations (note 26 Dividends from investment in joint ventures (note 3) Net cash flows for investments and intangibles Other Cash used in Investing activities FINANCING ACTIVITIES Increase (decrease in bank loans Issuance of notes note 13) Redemption of notes (noto 13) Financing fees (note 13) Issuance of shares under stock option plan Shares repurchased (note 15) Dividends paid Dividends paid to non-controlling interest Other 333,243 (587) 4,603 (29.925) 550.000 (500,000 (26.732) 884 (1.464 (56,696) 16,331) (10,727 165,474 (6,737) (2,960) 262.088 169,681) 81,266 11,585 (80.991) 62,068 19.198 81.266 Cash provided by (used in) financing activities Net change in cash and cash equivalents during the year Cash and cash equivalents, beginning of the year Cash and cash equivalents, end of the year Supplemental cash fow disclosures note 20 See accompanying notes Financial Reporting Problem BYP13-1 The shareholders' equity section for Corus Entertain- ment Inc. is shown in the consolidated balance sheet in Appendix A. You will also find data related to this problem in the notes to the financial statements. Instructions (a) How many classes of shares does Corus have? For each class of shares, specify how many shares are authorized and issued at August 31, 2014. (Hint: Refer to Note 15.) (b) Refer to Note 15 again. What are the rights of each class of shares (c) Did Corus issue any additional shares in fiscal 2014? If so, specify how many were issued, for what dollar amount, and for what purpose. (d) What was the average per share amount of each class of Corus's shares at the end of fiscal 2014? (e) Did Corus declare any cash dividends in fiscal 2014? If yes, how much? Corus's return on equity was calculated for fiscal 2014 in Illus- tration 13-8. Calculate the company's return on equity for fiscal 2013. Did this ratio improve or worsen from 2013 to 2014? (f) CONSOLIDATED STATEMENTS OF FINANCIAL POSITION As at September 1 As at August 31, 2014 As at August 31. 2013 2012 in thousands of Canadian dollars ASSETS Current Cash and cash equivalents Accounts receivable (notos 4 and 23) Promissory note receivable (note 26) Income taxes recoverable Propaid expenses and other Total current assets 11,585 183,009 19,108 163.345 61,286 164, 302 47,759 351 16,392 310.070 9,768 13.002 9,542 12.619 204,704 217,394 29,044 47,630 Tax credits receivable Investments and intangibles (note 5) Investment in joint ventures (note 26) Property, plant and equipment (note) Program and film rights (note 7 Film Investments note 8) Broadcast licenses (note 9) Goodwil note 9) Deferred tax assots (note 20) 143,618 330,437 63,455 979,984 934,859 38,161 2,784,582 41.554 42.975 125.931 151.192 232.587 62 274 515 038 646.045 39483 43,885 42.390 121,704 163,280 229,305 87 847 520,770 646,045 28.327 2,167,137 2,068,238 170,411 164.443 LIABILITIES AND SHAREHOLDERS' EQUITY Current Accounts payable and accrued abilities (note 11) Income taxes payable (note 20) Provisions (note 12) Total current abilities 3.041 5,314 175,725 177,367 1,303 2.322 180,992 168,384 874,251 171,793 252,687 538,968 93.241 145,713 518 258 87 588 145.310 1,474,456 940,304 932.148 Long-term debt (note 13) Other long-term labilities Note 14 Doforred tax labilities (note 20 Total liabilities SHAREHOLDERS' EQUITY Share capital (note 15) Contributed surplus Ratained earnings Accumulated other comprehensive Income (oss) (note 16) Total equity attributable to shareholders Equity attributable to non-controlling interest Total shareholders' equity 967,330 8.385 313.361 3,767 937,183 7.221 256,517 1,653 1,202,574 18.250 1.220,833 2,167,137 910,005 7.835 196,445 (812) 1,115,473 20,617 1,292,843 17,283 1,310,126 2.784 582 1,136.090 2,068,238 Commitments, contingencies and guarantos notes 13 and 27 See accompanying notes Total liabilities SHAREHOLDERS' EQUITY Share capital (note 15) Contributed surplus AS 967,330 8,385 313.361 Consolidated Statements of Income and Comprehensive Income APPENDI CONSOLIDATED STATEMENTS OF INCOME AND COMPREHENSIVE INCOME TAJOMOO 2014 2013 833,016 543,378 24,068 For the years ended August 31, in thousands of Canadian dollar per share amoures Revenues Direct cost of sales, general and administrative expenses (note 177 Depreciation and amortization (notes and Interest expense note 18 Broadcast license and goodwill impairment notes 9 and 10 Debt refinancing inate 13 Business acquisition, integration and restructuring costs (notos 12 and 20 Gain on acquisition note 26) Osin on sale of associated company note 20 Other expense incomel, not foto 19) ncome before income taxes Income tax perse note 20 751,536 500 562 26.812 44,795 5,734 25,033 83,000 45.792 (127,884) (55.394 (3,580) 5,740 209,602 53,433 200.211 Net income for the period 156,169 165,749 Net Income attributable to: Shareholders Non-controlling interest 150,408 5,761 156,109 150,895 5,854 168,749 Earnings per share attributable to shareholders Bic $ 1.77 $ 1.76 Dluned Net Income for the period 156,160 165.749 Other comprehensive income foss), net of tax: (note 16 1.720 2,333 Items that may be reclassified subsequently to net income: Unrealed foreign currency translation adustment United change in fair value of available for sale investments Unrealized change in fair value of cash fowledges Actuarial loss gain on employee future benefits 132 2.188) (74) 3.081 156,095 16530 Comprehensive Income for the period Comprehensive Income attributable to: Shareholders Non-controlling interest 169,976 150,034 5,761 150,005 168.830 See accompanying notes A6 APPENDIX A Specimen Financial Statements CONSOLIDATED STATEMENTS OF CHANGES IN SHAREHOLDERS' EQUITY Total Share capital Contributed o re 15) Surplus 937,183 7,221 Retained earrings 256,517 150.408 (2,188) (91.376) Accumulated other comprehensive income 088) note 16 1,653 (74) 2.188 Total equity attributable to shareholders 1.202.574 150,334 Non- controlling shareholders interest equity 18,259 1.220,833 5,761 156.095 (91,376) (6.737 (98,113) in thousands of Canadian dol At August 31, 2013 Comprehensive income foss Actuarial loss transfer Dividends declared Issuance of shares under stock option plan Issuance of shares under dividend reinvestment plan Share based compensation expense At August 31, 2014 4,600 4,603 5,465 (862) 24,682 24,682 24,682 2.026 2,026 8,385 2,026 1,292,843 313,361 967,330 3,767 17,283 1,310,126 910.005 7.835 (812) 3,081 (616) 1,115,473 162,976 20,617 6,854 198,445 159.896 616 184,452) 1,136,090 168,830 (84,452) (6,331) (90,783) 1,155 2.200) (1,045) (1,045) At August 31, 2012 Comprehensive Income Actuarial gain transfer Dividends declared Issuance of shares under stock option plan Issuance of shares under dividend roinvestment plan Shares repurchased Share-based compensation Brense Acquisition of non-controlling Interest rate 26) At August 31, 2013 See accompanying notes 26.731 (708) (756) 26.731 (1.464) 26.731 (1.464) 1,586 1,586 1,586 937.183 (17.231) 256,517 7 .221 (17.231) 1,202,574 1,663 (1.881) 18,259 (19,112) 1.220,833 Consolidated Statements of Cash Flows APPENULA NSOLIDATED STATEMENTS OF CASH FLOWS er the years ended August 31. o nde of Canadian dollar OPERATING ACTIVITIES Not income for the period deduct) non-cash items: 156.159 105,749 24,068 3.000 207 899 19 RON 5.838 3.338 20.812 5.734 16. BB3 25.759 (11,332) preciation and amortization (notes 5 and 6 lense and goodwill impairment notes and 1 s ition of program and fim rights fotos 7 and 12 pation of film Investments (notes 8 and 1 Deferred income taxes (note 20) w e in purchase price obligation note 2 mustment impairments notes 5, 8 and 19 chor based compensation expense note 15 imputed interest rate 1) Tangible benefit obligation (note 29 Debt refinancing note 13) Gain on sale of associated company note 20 Gain on acquisition (note 26) Othor w change in non-coch working capital balances related to operations (note 24 Payment of program and fim rights Net addinions to film investments 2.026 14.808 31,916 7,121 1.586 10.279 25.033 (55,394 (127,884 2.402 22.945 225.935 (25,349) 194,477 (14.383) 6.762 (159,802) 146.074 156,729 (13,028) (11,976) (497,393) 10.866 (10,855) 1652 (11,493 (5,384 (526,246) (13,670) Cash provided by operating activities INVESTING ACTIVITIES Additions to property, plant and equipment (note 6) Business combinations (note 26 Dividends from investment in joint ventures (note 3) Net cash flows for investments and intangibles Other Cash used in Investing activities FINANCING ACTIVITIES Increase (decrease in bank loans Issuance of notes note 13) Redemption of notes (noto 13) Financing fees (note 13) Issuance of shares under stock option plan Shares repurchased (note 15) Dividends paid Dividends paid to non-controlling interest Other 333,243 (587) 4,603 (29.925) 550.000 (500,000 (26.732) 884 (1.464 (56,696) 16,331) (10,727 165,474 (6,737) (2,960) 262.088 169,681) 81,266 11,585 (80.991) 62,068 19.198 81.266 Cash provided by (used in) financing activities Net change in cash and cash equivalents during the year Cash and cash equivalents, beginning of the year Cash and cash equivalents, end of the year Supplemental cash fow disclosures note 20 See accompanying notes
Step by Step Solution
There are 3 Steps involved in it

Get step-by-step solutions from verified subject matter experts