

Question: Financial Statement Analysis 1). Use the selected financial data for 2018, provided in the Excel Answer worksheet to calculate the following ratios. The ratio formulas
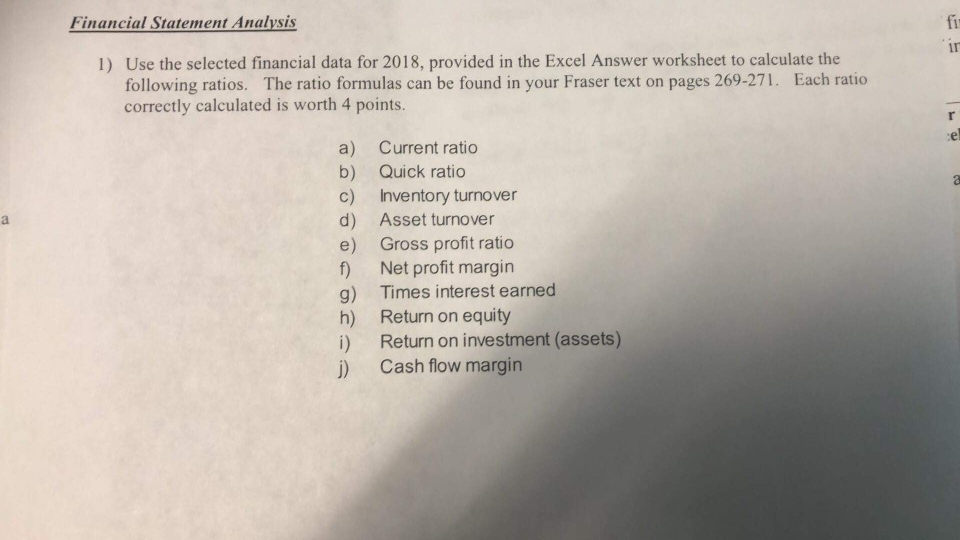
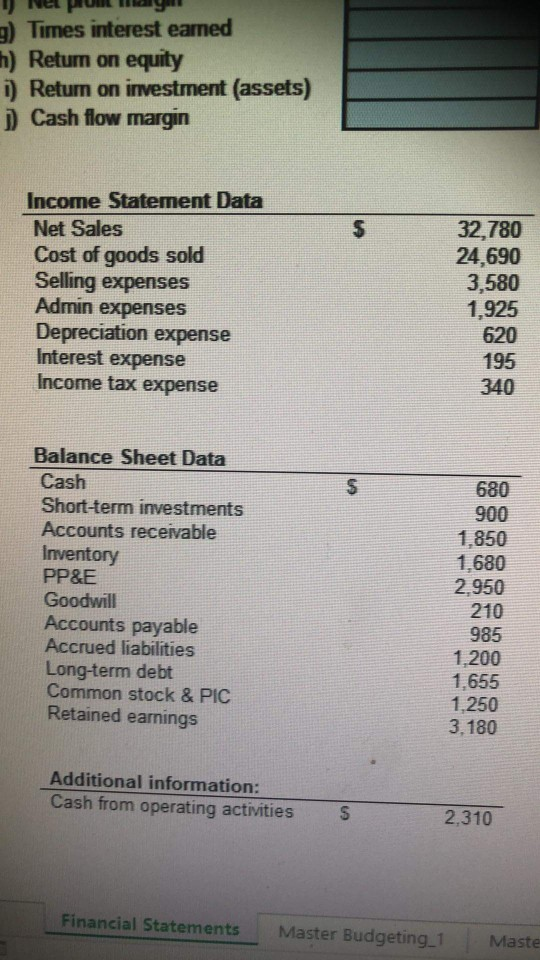
Financial Statement Analysis 1). Use the selected financial data for 2018, provided in the Excel Answer worksheet to calculate the following ratios. The ratio formulas can be found in your Fraser text on pages 269-271. Each ratio correctly calculated is worth 4 points. a) b) d) e) Current ratio Quick ratio Inventory turnover Asset turnover Gross profit ratio Net profit margin Times interest earned Return on equity Return on investment (assets) Cash flow margin g) h) j) 1) Ne pun lagi g) Times interest earned h) Retum on equity i) Return on investment (assets) 1) Cash flow margin Income Statement Data Net Sales Cost of goods sold Selling expenses Admin expenses Depreciation expense Interest expense Income tax expense 32.780 24,690 3,580 1,925 620 195 340 Balance Sheet Data Cash Short-term investments Accounts receivable Inventory PP&E Goodwill Accounts payable Accrued liabilities Long-term debt Common stock & PIC Retained earnings 680 900 1.850 1.680 2.950 210 985 1.200 1.655 1.250 3.180 Additional information: Cash from operating activities S 2.310 Financial Statements Master Budgeting_1 Maste
Step by Step Solution
There are 3 Steps involved in it

Get step-by-step solutions from verified subject matter experts