

Question: Financial Statement Analysis by using ratio analysis for Al Ain Diary Farm (CLO2). 2019 116 As at December 31, 2018 and 2019 (Millions of Dollars)
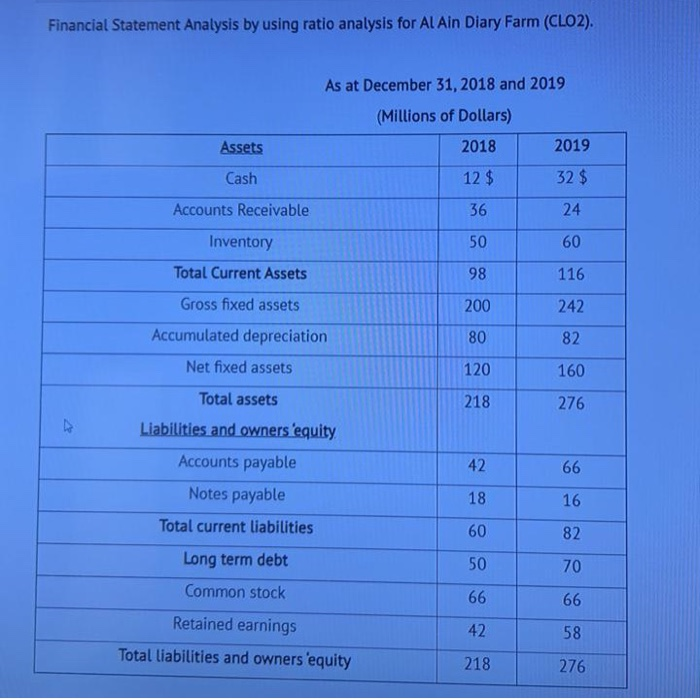
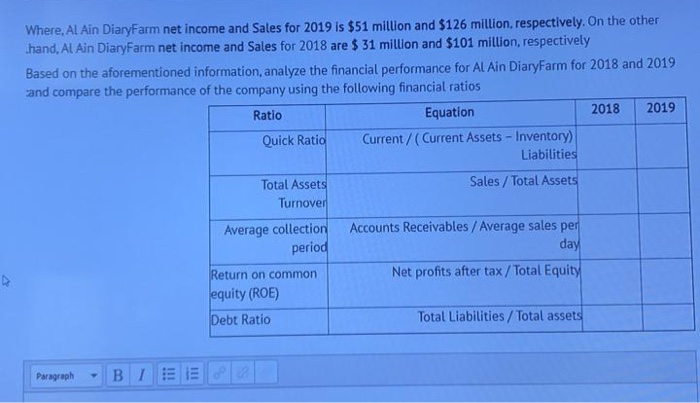
Financial Statement Analysis by using ratio analysis for Al Ain Diary Farm (CLO2). 2019 116 As at December 31, 2018 and 2019 (Millions of Dollars) Assets 2018 Cash 12 $ 32 $ Accounts Receivable 36 24 Inventory 50 60 Total Current Assets 98 Gross fixed assets 200 242 Accumulated depreciation 80 82 Net fixed assets 120 160 Total assets 276 Liabilities and owners 'equity Accounts payable 66 Notes payable 18 16 Total current liabilities 60 Long term debt Common stock 66 Retained earnings 42 Total liabilities and owners 'equity 218 276 218 42 50 66 58 Where. Al Ain DiaryFarm net income and Sales for 2019 is $51 million and $126 million, respectively. On the other .hand, Al Ain DiaryFarm net income and Sales for 2018 are $ 31 million and $101 million, respectively Based on the aforementioned information, analyze the financial performance for Al Ain DiaryFarm for 2018 and 2019 and compare the performance of the company using the following financial ratios Ratio Equation 2018 2019 Quick Ratio Current/(Current Assets - Inventory) Liabilities Total Assets Sales / Total Assets Turnover Average collection Accounts Receivables / Average sales per period day Return on common Net profits after tax / Total Equity equity (ROE) Debt Ratio Total Liabilities / Total assets Paragraph - B 5 E 2 2
Step by Step Solution
There are 3 Steps involved in it

Get step-by-step solutions from verified subject matter experts