

Question: Financial Statement Analysis : Compute the ratios for Juniper Networks fiscal 2018 and 2019 inclouding Price/Earnings Ratio Current Ratio Receivable Turnover Ratio Working Capital Return
Financial Statement Analysis : Compute the ratios for Juniper Networks fiscal 2018 and 2019 inclouding
Price/Earnings Ratio
Current Ratio
Receivable Turnover Ratio
Working Capital
Return on asset
Financial Leverage Ratio
Quick Ratio
Total Assets Turnover Ratio
Net Profit Margin
Inventory Turnover Ratio
Primary (Basic) earnings per share
Return on equity
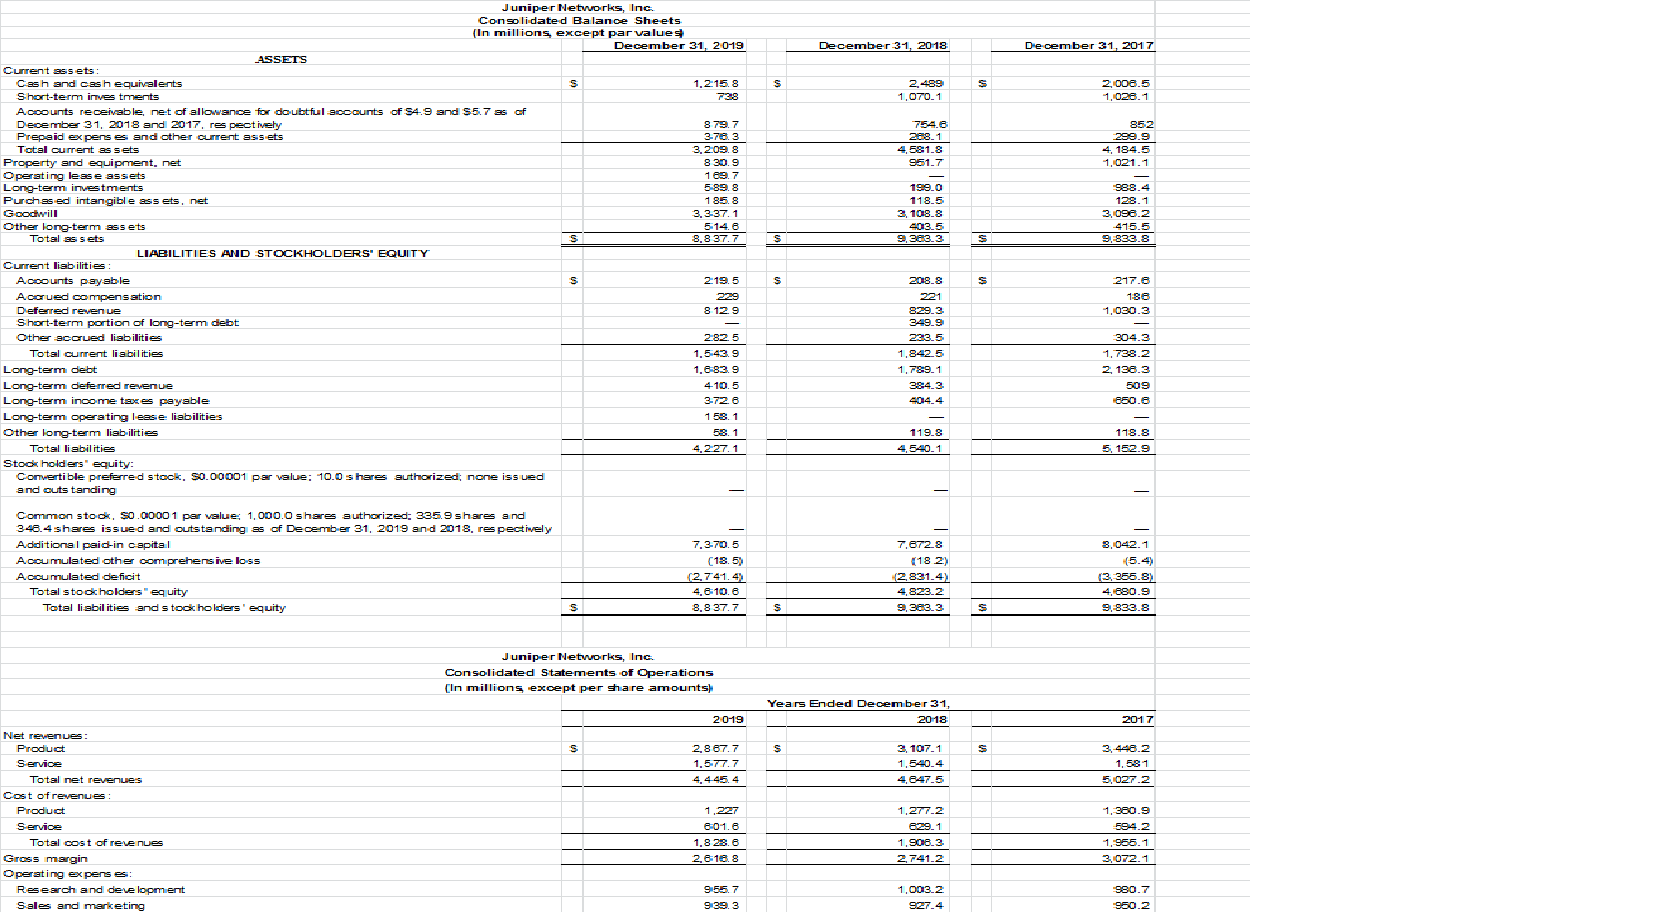
December 31, 2018 December 31, 2017 S 2.499 1,070.1 2.008.5 1,1026.1 852 299.9 4, 184.5 1,021.1 7554.6 2e8.1 4,581.8 951.7 199.0 118.5 3, 108.8 2013.5 9,303.3 -988.4 128.1 3,090.2 415.5 9,833.8 S Juniper Networks, Inc. Consolidated Balance Sheets (In millions except par values December 31, 2019 ASSETS Current assets Cash and cash equivalents 1.2 15.8 Short-term investments 738 Accounts receivable, net of allowance for doubtful-20Counts of $4.9 and 55.7 as of December 31, 2018 and 2017, respectively 8797 Prepaid expenses and other current ass ets 3.78.3 Tatal current as sets 3.2.098 Property and equipment, net 8 309 Operating lease assets 1 29.7 Long-term investments 5-89.8 Purchased intangible assets, net 18:58 Goodwill 3.3.37. 1 Other long-term ass ets 5 146 Total assets S 8.8 37.7 LIABILITIES AND STOCKHOLDERS' EQUITY Current liabilities Accounts payable 2:19.5 Accrued compensation 229 Deferred revenue 8 129 Short-term portion of long-term diebt Other accued liabilities 2825 Total cuinrent liabilities 1.5.43.9 Long-term debt 1.683.9 Long-tem em deferred revenue Long-term term income taxes payable 372.6 Long-term operating lease liabilities Other long-term liabilities 58.1 Total liabilities 4.227.1 Stockholders' equity: Convertible preferred stack, So. 00001 par value: 10.0 shares authorized: none iss vedi and outstanding S S 217.6 186 1,030.3 208.8 221 829.3 349.9 223.5 1,842.5 1.789.1 384.3 40144 304.3 1.738.2 2. 138.3 509 850.0 4-10.5 158.1 118.8 119.8 4,540.1 5. 152.9 Common stock, S0.00001 per value: 1.000.0 shares authorized: 335.9 shares and 348.4 shares issued and outstanding as of December 31, 2019 and 2018, respectively Additional paid-in capital Accumulated other comprehensive loss Accumulated deficit Total stockholders" equity Total liabilities and stockholders' equity 3,042.1 (5.4) 7.3.70.5 (185) (2.741.4) 4.6 10.6 8.8 37.7 7,672.8 (182) (2.831.4) 4,823.2 9,3es 3 (3.366.8) 4,680.9 9, 833.8 S Juniper Networks, Inc. Consolidated Statements of Operations [In millions except per share amounts Years Ended December 31, 2018 2019 2017 S 3. 446.2 2,8 67.7 1.577.7 4,445.4 3, 107.1 1.540.4 4,847.5 5,027.2 Net revenues Product Service Total net revenues Cost of revenues Product Service Total cost of revenues Gross margin Operating expenses Research and development Sales and marketing 1,277.2 29.1 601.6 1.8 28.6 2.6 18.8 1,380.9 594.2 -1.965.1 3,072.1 1,906.3 2,741.2 -980.7 9557 9 393 1,003.2 927.4 960.2
Step by Step Solution
There are 3 Steps involved in it

Get step-by-step solutions from verified subject matter experts