

Question: Financial Statement Analysis Horizontal & Vertical Analysis and Ratio Analysis Directions: Using Excel (access it via The HUB) to prepare your response. Office 365 Online
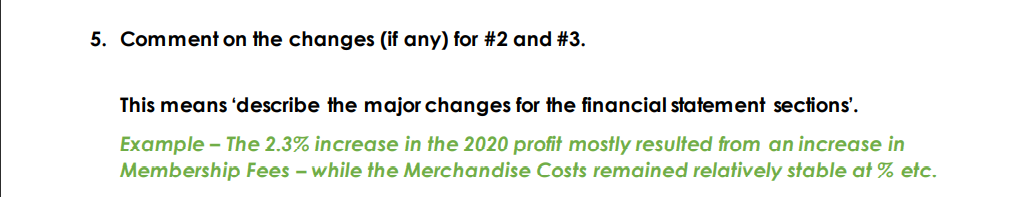
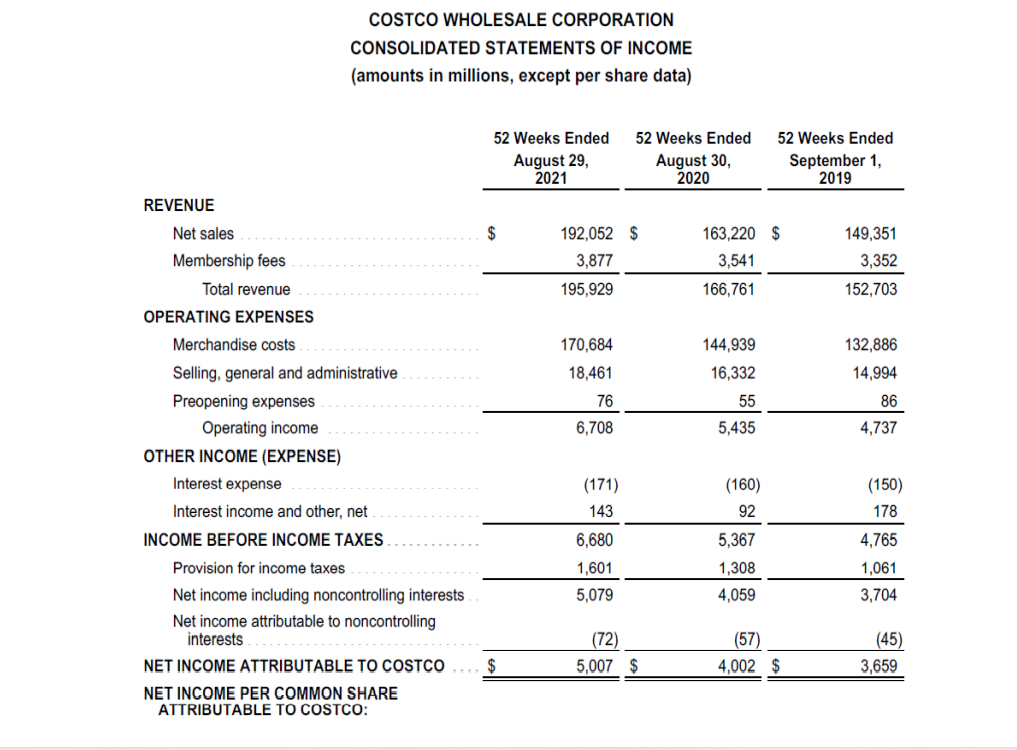
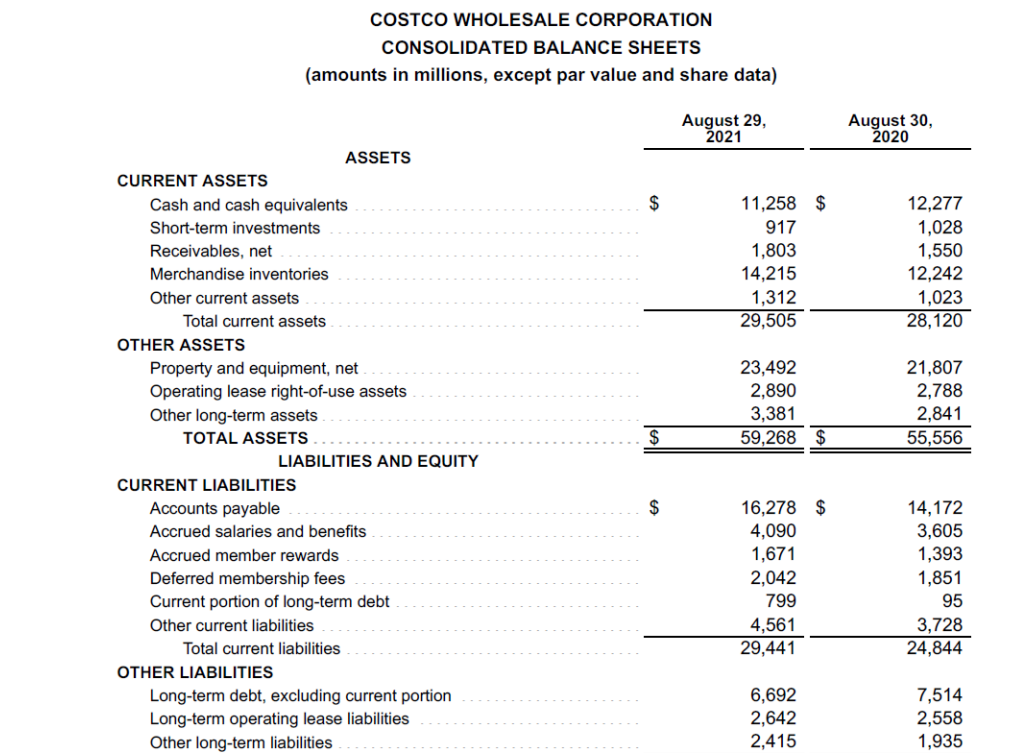
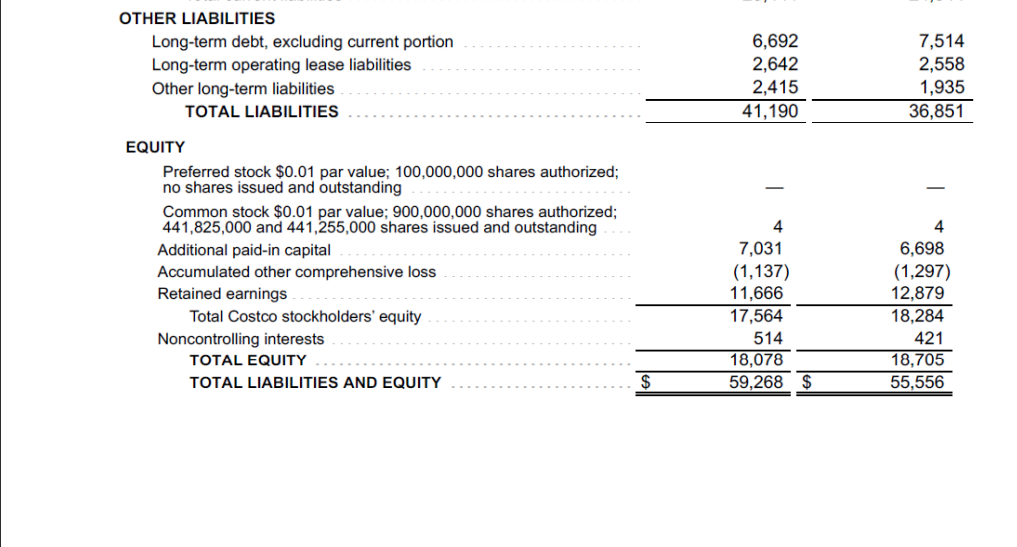
Financial Statement Analysis Horizontal & Vertical Analysis and Ratio Analysis Directions: Using Excel (access it via The HUB) to prepare your response. Office 365 Online version of Microsoft Office products (Word, Excel, OneNote, OneDrive) 1. Using the financial statements enter the data - including headings, labels and formatting so it appears similar to the financial statements. 2. Perform a Horizontal and Vertical Analysis of the financial statements and calculate the related change as a rate of percent (to 2 decimal places or nearest hundredth). 3. Set-up and label the following ratios for each year and calculate the change. a. Current Ratio b. Quick Ratio c. Debt to Assets Ratio d. Debt to Equity Ratio e. Return on Revenue Ratio 4. Using formulas - calculate the ratios (nearest tenth or one decimal place) 5. Comment on the changes (if any) for #2 and #3. This means 'describe the major changes for the financial statement sections'. Example - The 2.3% increase in the 2020 profit mostly resulted from an increase in Membership Fees - while the Merchandise Costs remained relatively stable at % etc. COSTCO WHOLESALE CORPORATION CONSOLIDATED STATEMENTS OF INCOME (amounts in millions, except per share data) 52 Weeks Ended August 29, 2021 52 Weeks Ended August 30, 2020 52 Weeks Ended September 1, 2019 192,052 $ 3,877 163,220 $ 3,541 149,351 3,352 152,703 195,929 166,761 170,684 18,461 76 6,708 144,939 16,332 55 5,435 132,886 14,994 86 4,737 REVENUE Net sales $ Membership fees Total revenue OPERATING EXPENSES Merchandise costs Selling, general and administrative Preopening expenses Operating income OTHER INCOME (EXPENSE) Interest expense Interest income and other, net INCOME BEFORE INCOME TAXES Provision for income taxes Net income including noncontrolling interests Net income attributable to noncontrolling interests NET INCOME ATTRIBUTABLE TO COSTCO ... $ NET INCOME PER COMMON SHARE ATTRIBUTABLE TO COSTCO: (171) 143 (150) 178 (160) 92 5,367 1,308 4,059 6,680 1,601 5,079 4,765 1,061 3,704 (72) 5,007 $ (57) 4,002 $ (45) 3,659 COSTCO WHOLESALE CORPORATION CONSOLIDATED BALANCE SHEETS (amounts in millions, except par value and share data) August 29, 2021 August 30, 2020 $ 11,258 $ 917 1,803 14,215 1,312 29,505 12,277 1,028 1,550 12,242 1,023 28,120 23,492 2,890 3,381 59,268 $ 21,807 2,788 2,841 55,556 ASSETS CURRENT ASSETS Cash and cash equivalents Short-term investments Receivables, net Merchandise inventories Other current assets Total current assets OTHER ASSETS Property and equipment, net Operating lease right-of-use assets Other long-term assets TOTAL ASSETS LIABILITIES AND EQUITY CURRENT LIABILITIES Accounts payable Accrued salaries and benefits Accrued member rewards Deferred membership fees Current portion of long-term debt Other current liabilities Total current liabilities OTHER LIABILITIES Long-term debt, excluding current portion Long-term operating lease liabilities Other long-term liabilities $ 16,278 $ 4,090 1,671 2,042 799 4,561 29,441 14,172 3,605 1,393 1,851 95 3,728 24,844 6,692 2,642 2,415 7,514 2,558 1,935 OTHER LIABILITIES Long-term debt, excluding current portion Long-term operating lease liabilities Other long-term liabilities TOTAL LIABILITIES 6,692 2,642 2,415 41,190 7,514 2,558 1,935 36,851 EQUITY Preferred stock $0.01 par value; 100,000,000 shares authorized; no shares issued and outstanding Common stock $0.01 par value; 900,000,000 shares authorized; 441,825,000 and 441,255,000 shares issued and outstanding Additional paid-in capital Accumulated other comprehensive loss Retained earnings Total Costco stockholders' equity Noncontrolling interests TOTAL EQUITY TOTAL LIABILITIES AND EQUITY 4 7,031 (1,137) 11,666 17,564 514 18,078 59,268 $ 4 6,698 (1,297) 12,879 18,284 421 18,705 55,556 $ Financial Statement Analysis Horizontal & Vertical Analysis and Ratio Analysis Directions: Using Excel (access it via The HUB) to prepare your response. Office 365 Online version of Microsoft Office products (Word, Excel, OneNote, OneDrive) 1. Using the financial statements enter the data - including headings, labels and formatting so it appears similar to the financial statements. 2. Perform a Horizontal and Vertical Analysis of the financial statements and calculate the related change as a rate of percent (to 2 decimal places or nearest hundredth). 3. Set-up and label the following ratios for each year and calculate the change. a. Current Ratio b. Quick Ratio c. Debt to Assets Ratio d. Debt to Equity Ratio e. Return on Revenue Ratio 4. Using formulas - calculate the ratios (nearest tenth or one decimal place) 5. Comment on the changes (if any) for #2 and #3. This means 'describe the major changes for the financial statement sections'. Example - The 2.3% increase in the 2020 profit mostly resulted from an increase in Membership Fees - while the Merchandise Costs remained relatively stable at % etc. COSTCO WHOLESALE CORPORATION CONSOLIDATED STATEMENTS OF INCOME (amounts in millions, except per share data) 52 Weeks Ended August 29, 2021 52 Weeks Ended August 30, 2020 52 Weeks Ended September 1, 2019 192,052 $ 3,877 163,220 $ 3,541 149,351 3,352 152,703 195,929 166,761 170,684 18,461 76 6,708 144,939 16,332 55 5,435 132,886 14,994 86 4,737 REVENUE Net sales $ Membership fees Total revenue OPERATING EXPENSES Merchandise costs Selling, general and administrative Preopening expenses Operating income OTHER INCOME (EXPENSE) Interest expense Interest income and other, net INCOME BEFORE INCOME TAXES Provision for income taxes Net income including noncontrolling interests Net income attributable to noncontrolling interests NET INCOME ATTRIBUTABLE TO COSTCO ... $ NET INCOME PER COMMON SHARE ATTRIBUTABLE TO COSTCO: (171) 143 (150) 178 (160) 92 5,367 1,308 4,059 6,680 1,601 5,079 4,765 1,061 3,704 (72) 5,007 $ (57) 4,002 $ (45) 3,659 COSTCO WHOLESALE CORPORATION CONSOLIDATED BALANCE SHEETS (amounts in millions, except par value and share data) August 29, 2021 August 30, 2020 $ 11,258 $ 917 1,803 14,215 1,312 29,505 12,277 1,028 1,550 12,242 1,023 28,120 23,492 2,890 3,381 59,268 $ 21,807 2,788 2,841 55,556 ASSETS CURRENT ASSETS Cash and cash equivalents Short-term investments Receivables, net Merchandise inventories Other current assets Total current assets OTHER ASSETS Property and equipment, net Operating lease right-of-use assets Other long-term assets TOTAL ASSETS LIABILITIES AND EQUITY CURRENT LIABILITIES Accounts payable Accrued salaries and benefits Accrued member rewards Deferred membership fees Current portion of long-term debt Other current liabilities Total current liabilities OTHER LIABILITIES Long-term debt, excluding current portion Long-term operating lease liabilities Other long-term liabilities $ 16,278 $ 4,090 1,671 2,042 799 4,561 29,441 14,172 3,605 1,393 1,851 95 3,728 24,844 6,692 2,642 2,415 7,514 2,558 1,935 OTHER LIABILITIES Long-term debt, excluding current portion Long-term operating lease liabilities Other long-term liabilities TOTAL LIABILITIES 6,692 2,642 2,415 41,190 7,514 2,558 1,935 36,851 EQUITY Preferred stock $0.01 par value; 100,000,000 shares authorized; no shares issued and outstanding Common stock $0.01 par value; 900,000,000 shares authorized; 441,825,000 and 441,255,000 shares issued and outstanding Additional paid-in capital Accumulated other comprehensive loss Retained earnings Total Costco stockholders' equity Noncontrolling interests TOTAL EQUITY TOTAL LIABILITIES AND EQUITY 4 7,031 (1,137) 11,666 17,564 514 18,078 59,268 $ 4 6,698 (1,297) 12,879 18,284 421 18,705 55,556 $
Step by Step Solution
There are 3 Steps involved in it

Get step-by-step solutions from verified subject matter experts