

Question: Financial Statement Analysis Merchandise inventory Summary Problem 15-2 Operating Results Net sales Cost of goods sold Interest expense Income from operations Income tax expense
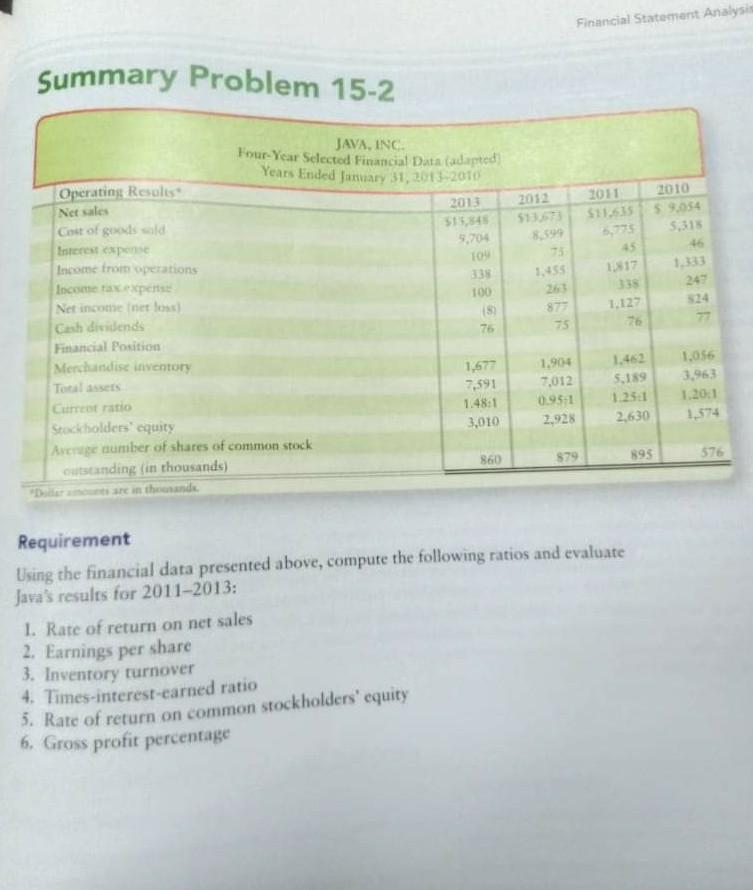
Financial Statement Analysis Merchandise inventory Summary Problem 15-2 Operating Results Net sales Cost of goods sold Interest expense Income from operations Income tax expense Net income (net loss) Cash dividends Financial Position JAVA, INC. Four-Year Selected Financial Data (adapted Years Ended January 31, 2013-2010 2013 2012 2011 2010 $15,848 $13,673 $11,635 $9,054 9,704 8,599 6,775 5,318 109 75 45 46 338 1,455 1,817 1,333 100 263 338 247 (8) 877 1,127 824 76 75 76 77 Total assets 1,677 1,904 1,462 1,056 Current ratio 7,591 7,012 5,189 3,963 Stockholders' equity 1.48:1 0.95:1 1.25:1 1.20:1 3,010 2,928 Average number of shares of common stock 2,630 1,574 outstanding (in thousands) 860 879 895 576 "Dolla ounts are in thousands Requirement Using the financial data presented above, compute the following ratios and evaluate Java's results for 2011-2013: 1. Rate of return on net sales 2. Earnings per share 3. Inventory turnover 4. Times-interest-earned ratio 5. Rate of return on common stockholders' equity 6. Gross profit percentage
Step by Step Solution
There are 3 Steps involved in it

Get step-by-step solutions from verified subject matter experts