

Question: FINANCIAL STATEMENT ANALYSIS. PLEASE START ON NUMBER 3 (A. HORIZONTAL ANALYSIS - PART 2 UNTIL NUMBER 3 - B. RATIO ANALYSIS, PART 3) Financial Statement
FINANCIAL STATEMENT ANALYSIS. PLEASE START ON NUMBER 3 (A. HORIZONTAL ANALYSIS - PART 2 UNTIL NUMBER 3 - B. RATIO ANALYSIS, PART 3)
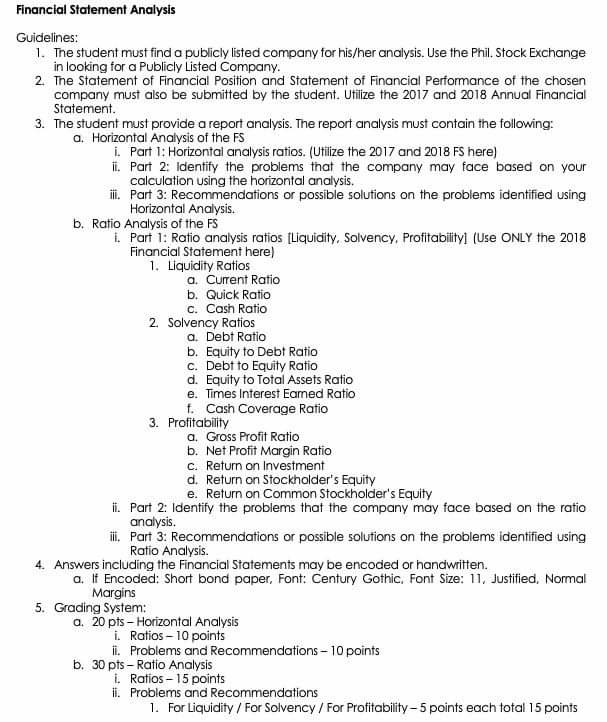
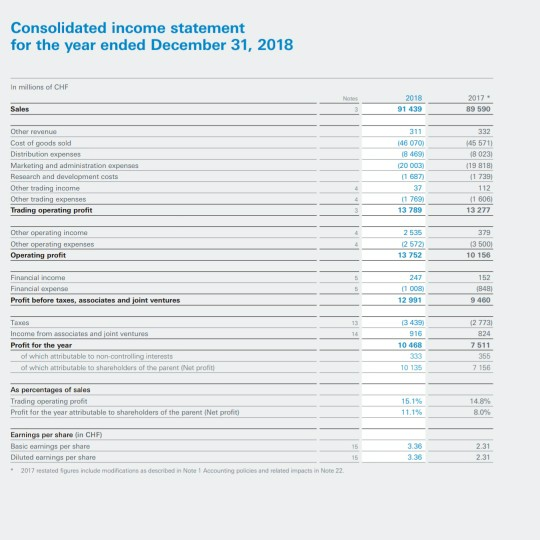
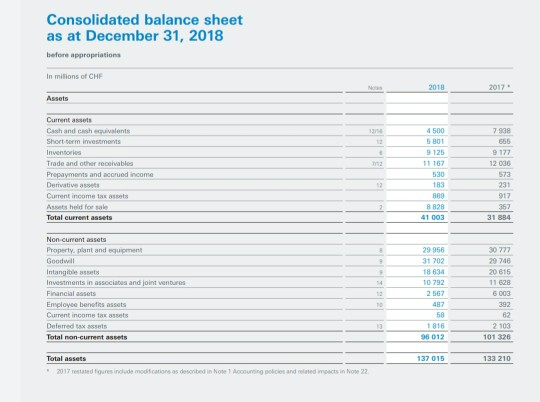
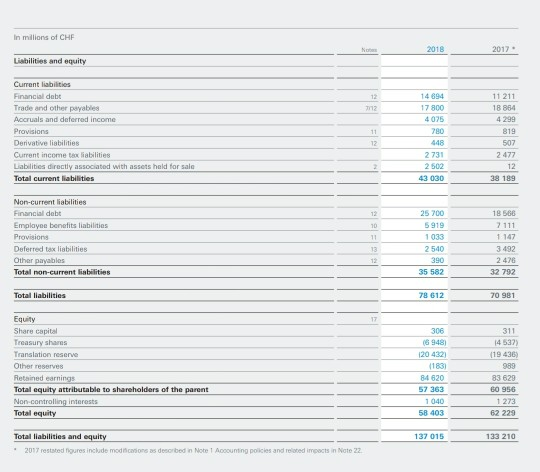
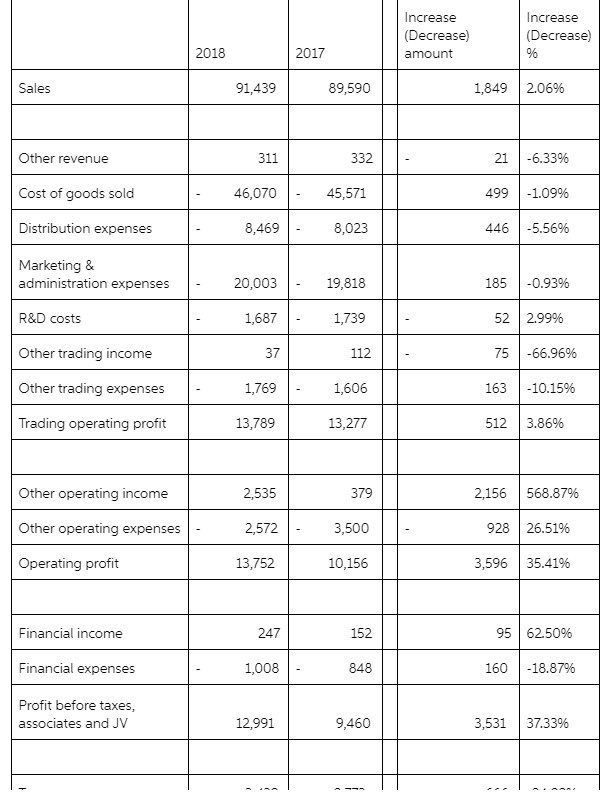
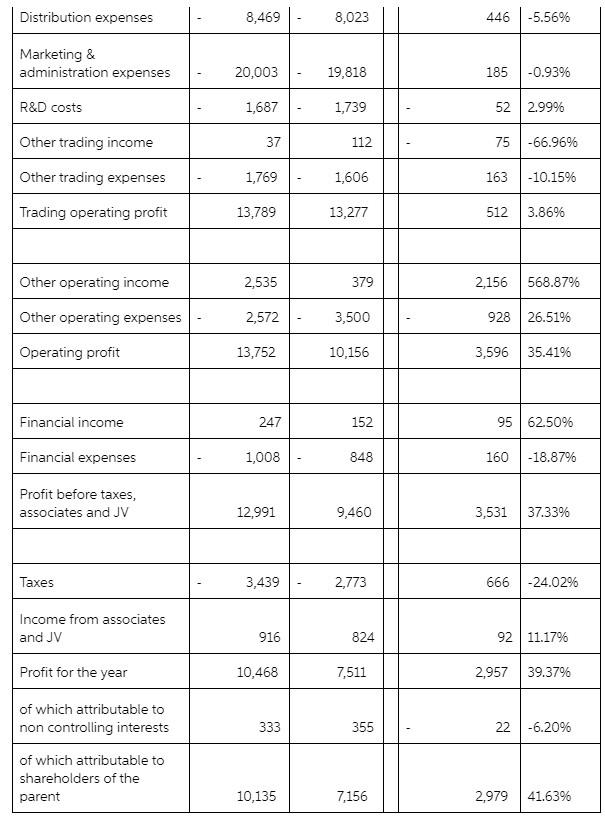
Financial Statement Analysis Guidelines: 1. The student must find a publicly listed company for his/her analysis. Use the Phil. Stock Exchange in looking for a Publicly Listed Company. 2 The Statement of Financial Position and Statement of Financial Performance of the chosen company must also be submitted by the student. Utilize the 2017 and 2018 Annual Financial Statement 3. The student must provide a report analysis. The report analysis must contain the following: a. Horizontal Analysis of the FS i. Part 1: Horizontal analysis ratios. (Utilize the 2017 and 2018 FS here) i. Part 2: Identify the problems that the company may face based on your calculation using the horizontal analysis. ii. Part 3: Recommendations or possible solutions on the problems identified using Horizontal Analysis. b. Ratio Analysis of the FS 1. Part 1: Ratio analysis ratios (Liquidity, Solvency, Profitability (Use ONLY the 2018 Financial Statement here) 1. Liquidity Ratios a. Current Ratio b. Quick Ratio C. Cash Ratio 2 Solvency Ratios a. Debt Ratio b. Equity to Debt Ratio c. Debt to Equity Ratio d. Equity to Total Assets Ratio e. Times Interest Eamed Ratio f. Cash Coverage Ratio 3. Profitability a. Gross Profit Ratio b. Net Profit Margin Ratio C. Return on Investment d. Return on Stockholder's Equity e. Return on Common Stockholder's Equity it. Part 2: Identify the problems that the company may face based on the ratio analysis. ill. Part 3: Recommendations or possible solutions on the problems identified using Ratio Analysis. 4. Answers including the Financial Statements may be encoded or handwritten. a. If Encoded: Short bond paper, Font: Century Gothic, Font Size: 11. Justified. Normal Margins 5. Grading System: a. 20 pts - Horizontal Analysis i. Ratios - 10 points i. Problems and Recommendations - 10 points b. 30 pts - Ratio Analysis i Ratios -15 points ii. Problems and Recommendations 1. For Liquidity / For Solvency / For Profitability - 5 points each total 15 points Consolidated income statement for the year ended December 31, 2018 in millions of CHF Sales 2018 91 439 2017 89 590 3 Other revenue Cost of goods sold Distribution expenses Marketing and administration expenses Research and development costs Other trading income Other trading expenses Trading operating profit 146 070 18 469 120 003) (1 687) 37 11 7690 13 789 332 455711 18 023) (19 818) (1 739 112 (1 6061 13 277 3 379 Other operating income Other operating expenses Operating profit 2535 12 572) 13 752 13 5001 10 156 5 Financial income Financial expense Profit before taxes, associates and joint ventures 247 11 008) 12 991 152 1848 9460 13 Tas Income from associates and joint ventures Profit for the year of which attributable to non-controlling interests of which attributable to shareholders of the parent (Net profit 13439 916 10 468 (27731 824 7511 355 7 156 10 135 As percentages of sales Trading operating profit Profit for the year attributable to shareholders of the parent (Net profit) 15.1% 11.1% 14.8% 8.0% Earnings per share in CHF) Basic eamings per share Diluted earings per share * 2017 restatedres include modifications as described in None Accounting policies and related impact in Note 22 2.31 2.31 15 Consolidated balance sheet as at December 31, 2018 before appropriations In millions of CHF 2018 2017 Assets 7938 9177 12 038 Current assets Cash and cash equivalents Short term investments Inventories Trade and other receivables Prepayments and accrued income Derivative assets Current income tax assets Assets held for sale Total current assets 4 500 5801 9 125 11 167 530 183 889 B 828 41 003 12 231 917 357 3 31 884 30 777 29 746 20 615 Non current assos Property, plant and equipment Goodwill Intangible assets Investments in associates and joint ventures Financial assets Employee benefits assets Current income tax assets Deferred to assets Total non current assets 29 956 31 702 18 634 10 792 2507 487 58 1 816 96 012 6003 392 82 2 103 101 326 137 015 133 210 Total assets 2017 restate foresindude medications as described in No1 Accounting policies and get mots in None 22 In millions of CHF 2018 2017 - Liabilities and equity 12 712 Current liabilities Financial debt Trade and other payables Accruals and deferred income Provisions Derivative liabilities Current income tax liabilities Liabilities directly associated with assets held for sale Total current liabilities 11 12 14 694 17 800 4075 780 448 2731 2 502 43 030 11 211 18 864 4299 819 507 2477 12 38 189 10 Non-current liabilities Financial debt Employee benefits liabilities Provisions Deferred tax liabilities Other payables Total non-current liabilities 25 700 5919 1033 2540 390 35 582 18 566 7 111 1 147 3492 2476 32 792 13 12 Total liabilities 78 612 70 981 17 Equity Share capital Treasury shares Translation reserve Other reserves Retained earnings Total equity attributable to shareholders of the parent Non-controlling interests Total equity 306 (6 948) 120 4321 (183) 84620 57 363 1040 58 403 311 14537 (19 436 989 83 629 50 956 1273 62 229 137 015 133 210 Total liabilities and equity 2017 reststedigures include modications as described in Note 1 Accounting policies and related impacts in Note 22 Increase (Decrease) amount Increase (Decrease) % 2018 2017 Sales 91,439 89,590 1,849 2.06% Other revenue 311 332 21 -6.33% Cost of goods sold 46,070 45,571 499 -1.09% Distribution expenses 8,469 8,023 446 -5.56% Marketing & administration expenses 20,003 19,818 185 -0.93% R&D costs 1,687 1,739 52 2.99% Other trading income 37 112 75 -66.96% Other trading expenses 1,769 1,606 163 -10.15% Trading operating profit 13,789 13,277 512 3.86% Other operating income 2,535 379 2,156 568.87% Other operating expenses 2,572 3,500 928 26.51% Operating profit 13,752 10,156 3,596 35.41% Financial income 247 152 9562.50% Financial expenses 1,008 848 160 -18.87% Profit before taxes, associates and JV 12,991 9,460 3,531 37.33% Distribution expenses 8,469 8,023 446 -5.56% Marketing & administration expenses 20,003 19,818 185 -0.93% R&D costs 1,687 1,739 52 2.99% Other trading income 37 112 75 -66.96% Other trading expenses 1,769 1,606 163 -10.15% Trading operating profit 13,789 13,277 512 3.86% Other operating income 2,535 379 2,156 568.87% Other operating expenses 2,572 3,500 928 26.51% Operating profit 13,752 10,156 3,596 35.41% Financial income 247 152 9562.50% Financial expenses 1,008 848 160 -18.87% Profit before taxes, associates and JV 12,991 9,460 3,531 37.33% Taxes 3,439 2,773 666 -24.02% Income from associates and JV 916 824 9211.17% Profit for the year 10,468 7,511 2,957 39.37% of which attributable to non controlling interests 333 355 22 -6.20% of which attributable to shareholders of the parent 10,135 7,156 2,979 41.63%
Step by Step Solution
There are 3 Steps involved in it

Get step-by-step solutions from verified subject matter experts