

Question: Financial statement analysis please use Excel chart step by step 45. FINANCIAL RATIOS DuBois Furniture, Inc., reported these figures for 20x7 and 20x6: 20x7 20x6
Financial statement analysis please use Excel chart step by step

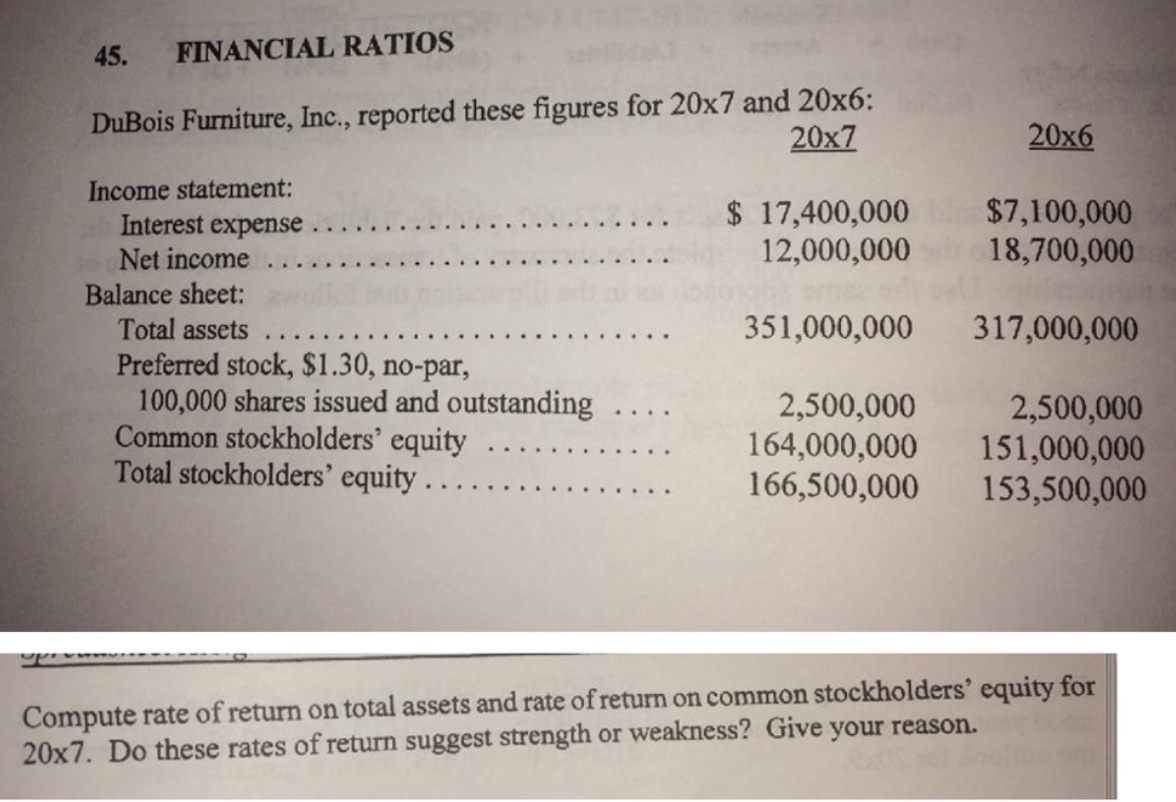
45. FINANCIAL RATIOS DuBois Furniture, Inc., reported these figures for 20x7 and 20x6: 20x7 20x6 Income statement: Interest expense . .. $ 17,400,000 $7,100,000 Net income 12,000,000 18,700,000 Balance sheet: Total assets .... 351,000,000 317,000,000 Preferred stock, $1.30, no-par, 100,000 shares issued and outstanding 2,500,000 Common stockholders' equity ........ 2,500,000 Total stockholders' equity . .... 164,000,000 151,000,000 166,500,000 153,500,000 Compute rate of return on total assets and rate of return on common stockholders' equity for 20x7. Do these rates of return suggest strength or weakness? Give your reason
Step by Step Solution
There are 3 Steps involved in it

Get step-by-step solutions from verified subject matter experts