

Question: Financial Statement Analysis Project Your client is trying to decide whether to invest in Pepsi or Coke. They ask you, as an accounting expert, to
Financial Statement Analysis Project Your client is trying to decide whether to invest in Pepsi or Coke. They ask you, as an accounting expert, to make an analysis of the company for them. Analyze at least one liquidity ratio for two companies for two years that would be important to an investor, and discuss whether your companys performance related to these items appeared to be improving, deteriorating, or remaining stable. Justify your answer. Analyze at least one profitability ratios for two companies for two years that would be important to an investor, and discuss whether your companys performance related to these items appeared to be improving, deteriorating, or remaining stable. Justify your answer. Analyze at least one solvency ratios for two companies for two years that would be important to an investor, and discuss whether your companys performance related to these items appeared to be improving, deteriorating, or remaining stable. Justify your answer. Identify two items not included in the financial statement (qualitative) that you think would be important to someone considering whether to invest in your company. Discuss your reasons for believing that these two items about the company would be important in making an investment decision. Compare two companies financial statements. If you are making a decision to invest in one of the two companies, which company would you choose? Why? Your answer in this section must include some financial issues, but your answer need not be limited to a discussion of financial issues.
Using 2014 to 2015.
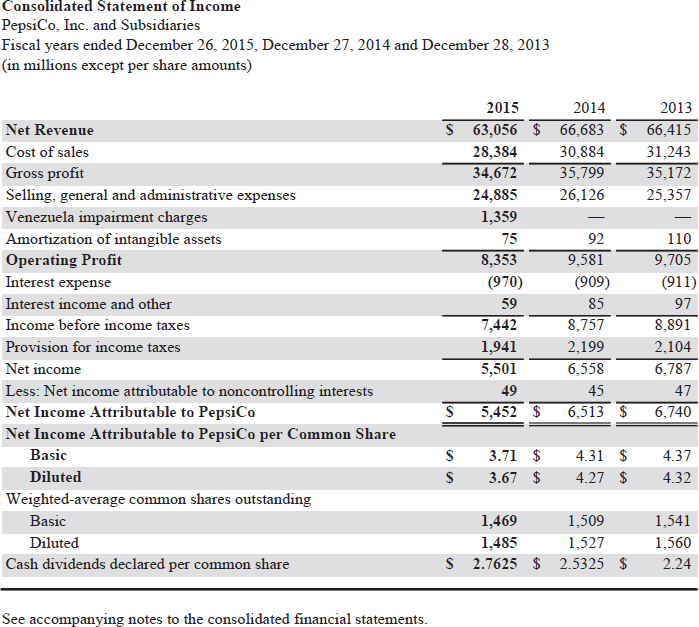
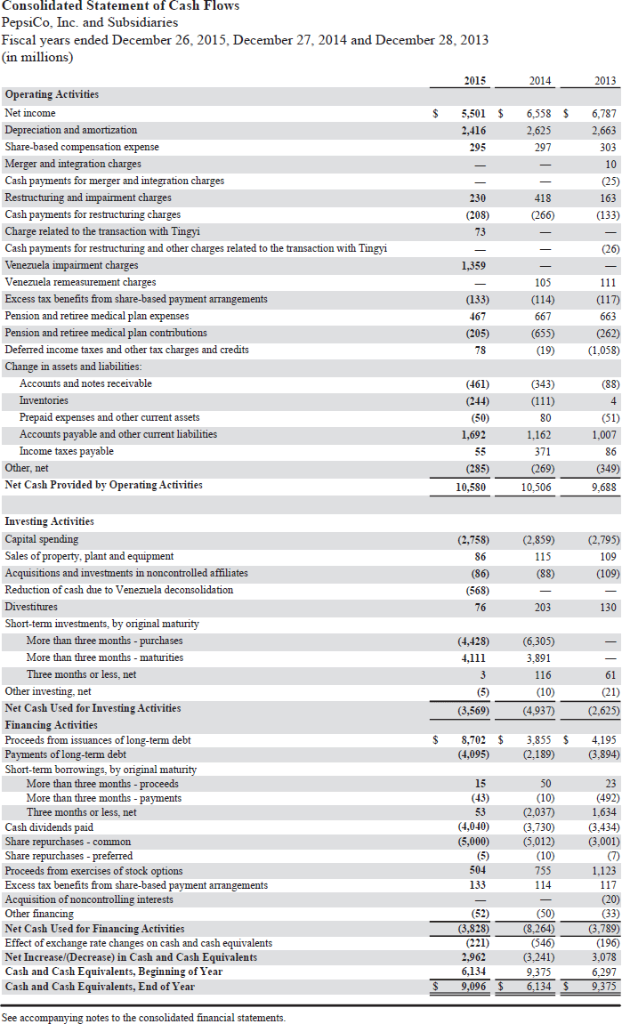
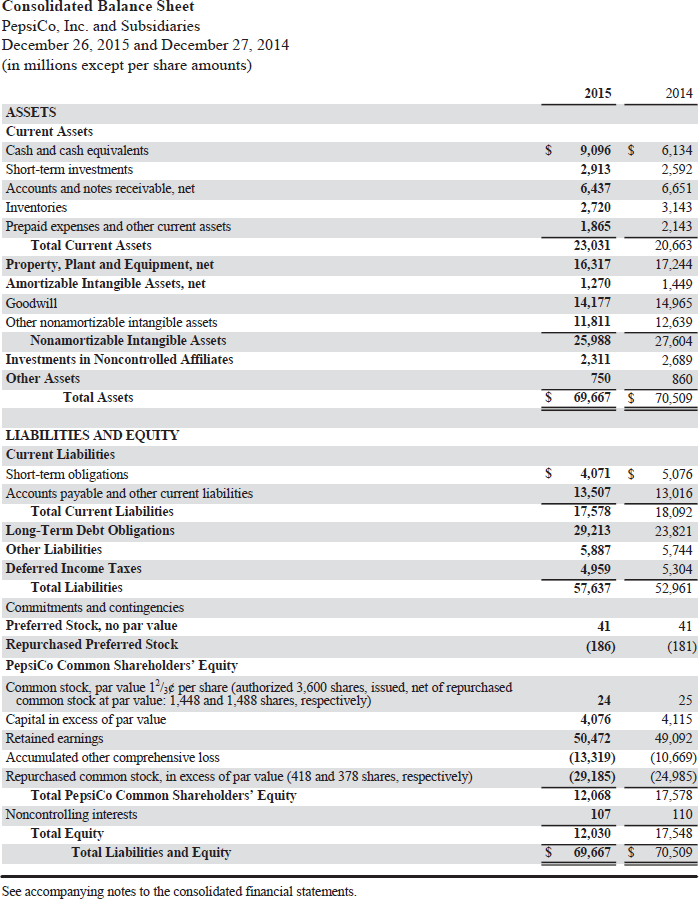
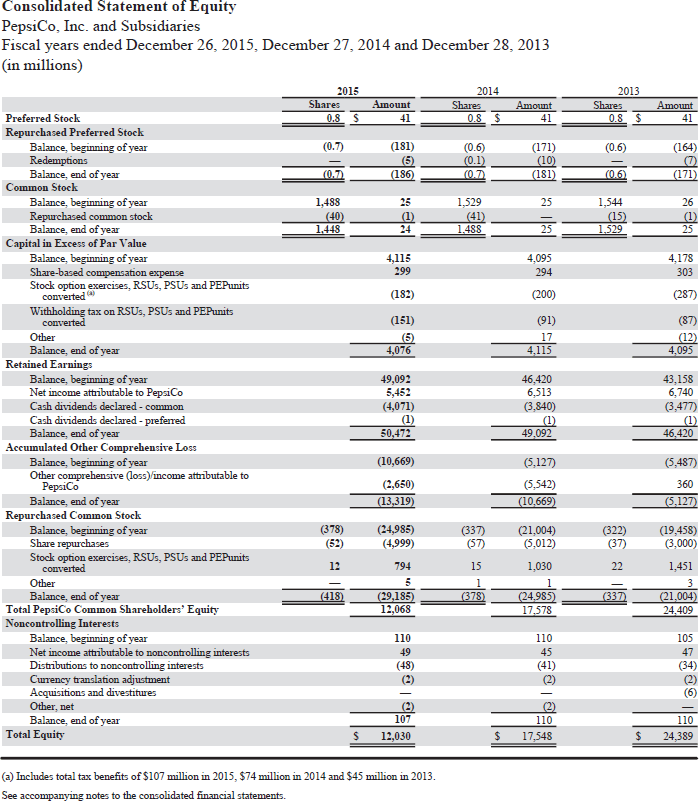
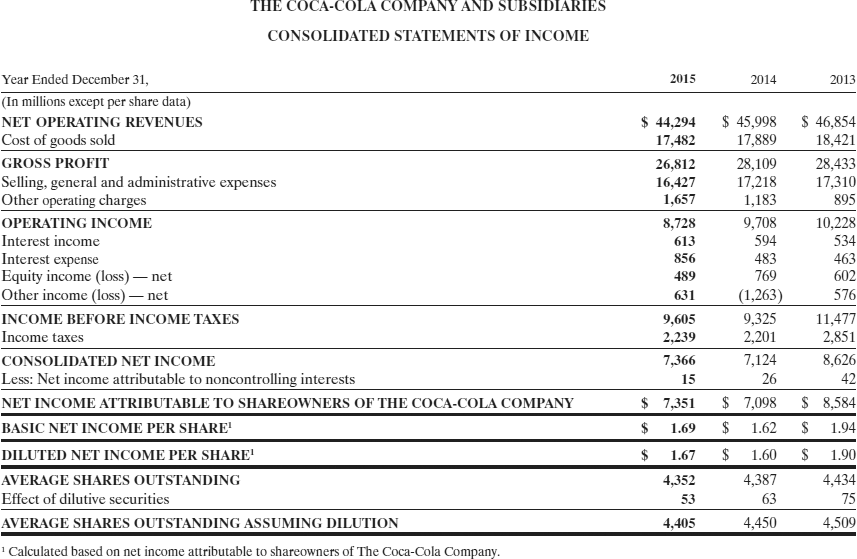
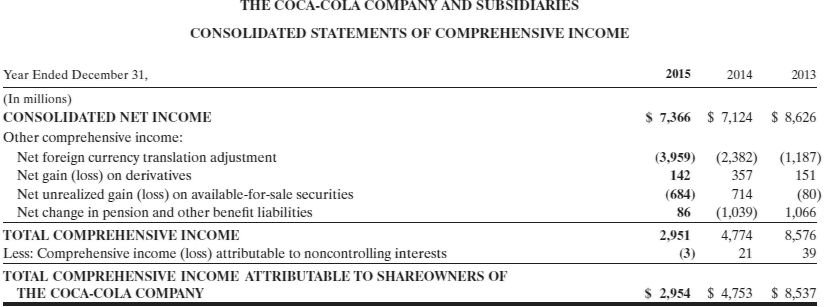
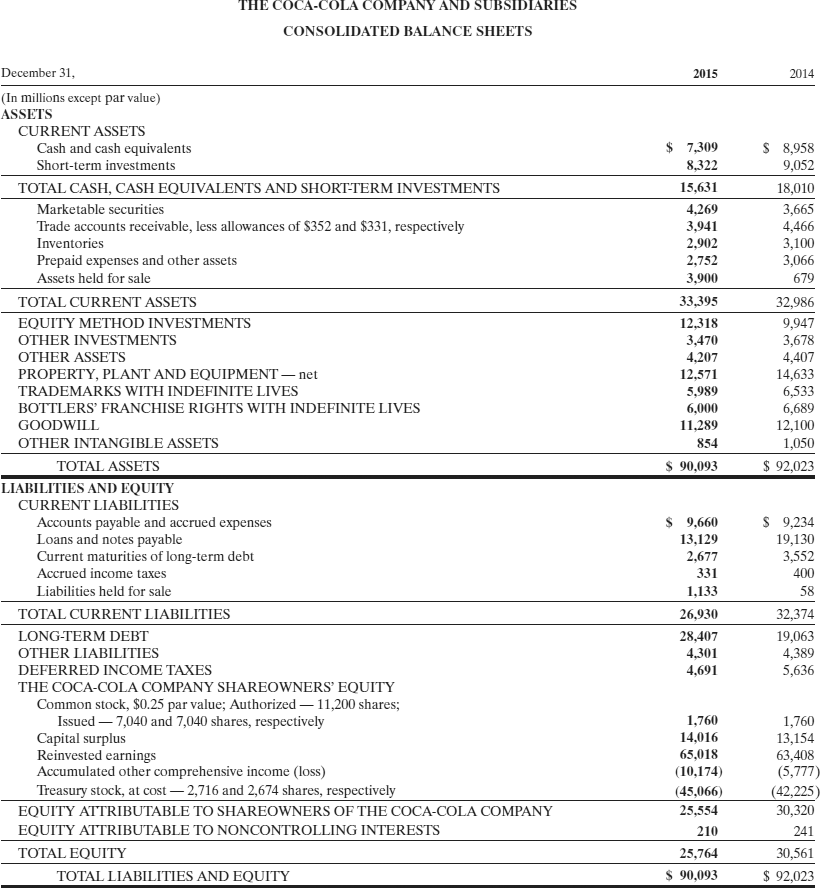
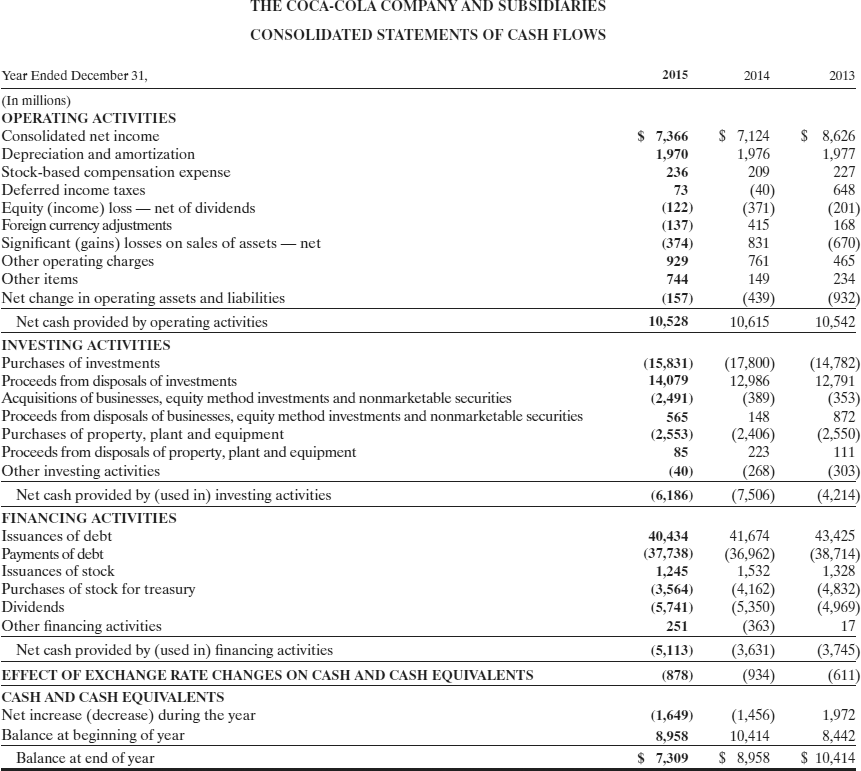
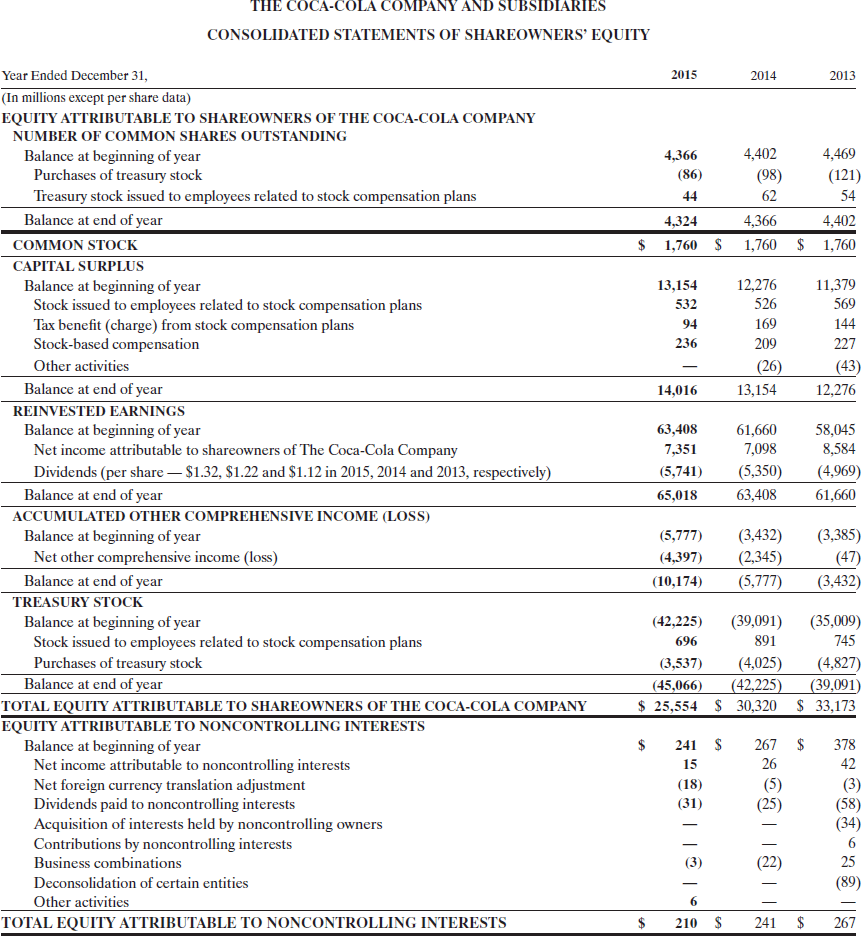
Consolidated Statement of Income PepsiCo, Inc. and Subsidiaries Fiscal years ended December 26, 2015, December 27, 2014 and December 28, 2013 (in millions except per share amounts) Net Revenue Cost of sales Gross profit Selling, general and administrative expenses Venezuela impairment charges Amortization of intangible assets Operating Profit Interest expense Interest income and other Income before income taxes Provision for income taxes Net income Less: Net income attributable to noncontrolling interests Net Income Attributable to PepsiCo Net Income Attributable to PepsiCo per Common Share Basic Diluted Weighted-average common shares outstanding Basic Diluted Cash dividends declared per common share 2015 2014 2013 $ 63,056 $ 66,683 $ 66,415 28,384 30,884 31,243 34,672 35,799 35,172 24,885 26.126 25,357 1,359 75 92 110 8,353 9,581 9,705 (970) (909) (911) 59 85 97 7,442 8,757 8,891 1,941 2,199 2,104 5,501 6,558 6,787 49 45 S 5,452 $ 6,513 $ 6,740 47 S S 3.71 $ 3.67 $ 4.31 $ 4.27 $ 4.37 4.32 1,469 1,509 1,485 1,527 2.7625 $ 2.5325 $ 1,541 1,560 S 2.24 See accompanying notes to the consolidated financial statements. Cisoitteell Starkannt of Columns Pages Tors, bord. Solusidledes bellyeztes social Dersandaar 26, 2015, Deanalar 27,2014 dikaresmibear X 2013 Gral souri) AS 2014 Operating Activities $ $ 2,416 2.625 707 2,663 PU 10 230 418 163 73 246 1,359 1701 Depreciation and amortization Silenangehenge Merger and integration charges Oljefie Forma prawna fionediengest Restructuring and impairment charges Gdje fordi dengpt Charge related to the transaction with Tingyi Giedlugar. Sinestonding audiolacicapsedkial telefonie wysi Venezuela impairment charges cinehieani Excess tax benefits from share-based payment arrangements Roution tamilroinemploail thangai Pension and retiree medical plan contributions Socconcellodiac foedingssiloezii Change in assets and liabilities: Besson and waistmid: Inventories Neuro ayos loitar coupon Accounts payable and other current liabilities huoneide: Other, net trait Sonstitillyfis decision (133) 41 (205) YN (114) GOX (655) (117) 28 (262 Man (244) C- 1,692 4 00 1,007 (111) SiQ 1,162 37 (269) SI (349) (285) NASTO (2,859) (2.758) SA (86) (2,795) 10019 (109) (88) 76 203 130 (6,305) (4,428) 4,001 3 116 0 (4,937) 61 22 (2,625 (3,569) Landing Ardisies Capital spending Sites joguigdemudikapeigantar Acquisitions and investments in noncontrolled affiliates Easiurediaashailnefits warhirshtatemeridishtion, Divestitures Sed feum intimtari, lyraugjiri waliouby More than three months - purchases Moussillanilgenden Three months or less, net riming. Net Cash Used for Investing Activities Financing Activities thaaik ficomissitana thitar tormitate Payments of long-term debt Sed feum og lycugina webu More than three months - proceeds Woche- Three months or less, net Qolliwoordeel Share repurchases - common Single wedisjonell Proceeds from exercises of stock options best fra konstaton saso leelarvel Store Acquisition of noncontrolling interests Calle Net Cash Used for Financing Activities 1:Sbadi didingsidigcntiailcasincapaiseltank Net Increase/(Decrease) in Cash and Cash Equivalents Qidl mit Solidarike in odstrar Cash and Cash Equivalents, End of Year SOS (4,095) (2.189 (3.894 50 23 15 CIBE 53 1040) (5,000) 1,634 (2,037) ELTS (5,012) Oy 755 (3,001) 504 1,123 (20) (3,828) (8,264) (3,789) (6 3,078 (3.241) 2,962 QCM 9,096 $ 6,134 $ 9.375 Samsoning desa fie file conteloklical suo id safewave Consolidated Balance Sheet PepsiCo, Inc. and Subsidiaries December 26, 2015 and December 27, 2014 (in millions except per share amounts) 2015 2014 $ ASSETS Current Assets Cash and cash equivalents Short-term investments Accounts and notes receivable. net Inventories Prepaid expenses and other current assets Total Current Assets Property, Plant and Equipment, net Amortizable Intangible Assets, net Goodwill Other nonamortizable intangible assets Nonamortizable Intangible Assets Investments in Noncontrolled Affiliates Other Assets Total Assets 9,096 $ 6,134 2,913 2,592 6,437 6,651 2,720 3,143 1,865 2.143 23,031 20,663 16,317 17.244 1,270 1,449 14,177 14,965 11,811 12,639 25,988 27,604 2,311 2,689 750 860 69,667 $ 70,509 $ $ 4,071 $ 13,507 17,578 29,213 5,887 4,959 57,637 5,076 13,016 18,092 23.821 5,744 5,304 52,961 LIABILITIES AND EQUITY Current Liabilities Short-term obligations Accounts payable and other current liabilities Total Current Liabilities Long-Term Debt Obligations Other Liabilities Deferred Income Taxes Total Liabilities Commitments and contingencies Preferred Stock, no par value Repurchased Preferred Stock PepsiCo Common Shareholders' Equity Common stock, par value 12/3 per share (authorized 3,600 shares, issued, net of repurchased common stock at par value: 1,448 and 1,488 shares, respectively) Capital in excess of par value Retained earnings Accumulated other comprehensive loss Repurchased common stock, in excess of par value (418 and 378 shares, respectively) Total PepsiCo Common Shareholders' Equity Noncontrolling interests Total Equity Total Liabilities and Equity 41 (186) 41 (181) 24 4,076 50,472 (13,319) (29,185) 12,068 107 12,030 69,667 $ 25 4,115 49,092 (10,669) (24,985) 17,578 110 17,548 70,509 $ See accompanying notes to the consolidated financial statements. Consolidated Statement of Equity PepsiCo, Inc. and Subsidiaries Fiscal years ended December 26, 2015, December 27, 2014 and December 28, 2013 (in millions) 2015 Shares 0.85 Amount 41 2014 Shares 0.8 $ Amount 41 2013 Shares 0.8 $ Amount 41 (0.7) (0.6) (181) (6) (186) (0.6) (0.1) (0.7 (171) (10) (181) (164) (7) (171) (0.7) (06) 25 1,544 1,488 (40) 1.448 25 (1) 24 1,529 (41) 1.488 (15) 1.529 26 (1) 25 25 4,115 299 4,095 294 4,178 303 (287) (182) (151) 6 4,076 (200) (91) 17 4,115 (87) (12) 4,095 Preferred Stock Repurchased Preferred Stock Balance, beginning of year Redemptions Balance, end of year Common Stock Balance, beginning of year Repurchased common stock Balance, end of year Capital in Excess of Par Value Balance, beginning of year Share-based compensation expense Stock option exercises, RSUS, PSUs and PEPunits converted Withholding tax on RSUS, PSUs and PEPunits converted Other Balance, end of year Retained Earnings Balance, beginning of year Net income attributable to PepsiCo Cash dividends declared - common Cash dividends declared - preferred Balance, end of year Accumulated Other Comprehensive Loss Balance, beginning of year Other comprehensive (loss) income attributable to PepsiCo Balance, end of year Repurchased Common Stock Balance, beginning of year Share repurchases Stock option exercises, RSUS, PSUs and PEPunits converted Other Balance, end of year Total PepsiCo Common Shareholders' Equity Noncontrolling Interests Balance, beginning of year Net income attributable to noncontrolling interests Distributions to noncontrolling interests Cwrency translation adjustment Acquisitions and divestitures Other, net Balance, end of year Total Equity 49,092 5,452 (4,071) (1) 50,472 46,420 6,513 (3,840) (1) 49,092 43,158 6,740 (3,477) (1) 46,420 (10,669) (5,487) (2,650) (13,319) (5.127) (5,542) (10,669) 360 (5,127) (378) (24,985) (4,999) 794 (337) (57) (21,004) (5.012) 1,030 (322) (37) (19,458) (3.000) 12 15 22 1,451 3 (21,004) 24.409 (418) (378) (337) (29,185) 12,068 (24.985) 17.578 110 49 (48) (2) 110 45 (41) 105 47 (34) (2) (6 (2) 107 12,030 (2) 110 17,548 110 24,389 $ $ $ (2) Includes total tax benefits of $107 million in 2015, $74 million in 2014 and $45 million in 2013. See accompanying notes to the consolidated financial statements. THE COCA-COLA COMPANY AND SUBSIDIARIES CONSOLIDATED STATEMENTS OF INCOME 2015 2014 2013 Year Ended December 31, (In millions except per share data) NET OPERATING REVENUES Cost of goods sold GROSS PROFIT Selling, general and administrative expenses Other operating charges OPERATING INCOME Interest income Interest expense Equity income (loss) net Other income (loss) net INCOME BEFORE INCOME TAXES Income taxes CONSOLIDATED NET INCOME Less: Net income attributable to noncontrolling interests NET INCOME ATTRIBUTABLE TO SHAREOWNERS OF THE COCA-COLA COMPANY BASIC NET INCOME PER SHARE DILUTED NET INCOME PER SHARE AVERAGE SHARES OUTSTANDING Effect of dilutive securities AVERAGE SHARES OUTSTANDING ASSUMING DILUTION Calculated based on net income attributable to shareowners of The Coca-Cola Company. $ 44,294 17,482 26,812 16,427 1,657 8,728 613 856 489 631 9,605 2,239 7,366 15 $ 45,998 17,889 28,109 17,218 1,183 9,708 594 483 769 (1,263) 9,325 2,201 7,124 26 $ 7,098 $ 1.62 $ 46,854 18,421 28,433 17,310 895 10,228 534 463 602 576 11,477 2,851 8,626 42 $ 8,584 $ 1.94 $ 7,351 $ 1.69 $ 1.67 $ 1.60 $ 4,352 53 4,387 63 4,450 1.90 4,434 75 4,509 4,405 THE COCA-COLA COMPANY AND SUBSI ARIES CONSOLIDATED STATEMENTS OF COMPREHENSIVE INCOME 2015 2014 2013 $ 7,366 $ 7,124 $ 8,626 Year Ended December 31, (In millions) CONSOLIDATED NET INCOME Other comprehensive income: Net foreign currency translation adjustment Net gain (loss) on derivatives Net unrealized gain (loss) on available-for-sale securities Net change in pension and other benefit liabilities TOTAL COMPREHENSIVE INCOME Less: Comprehensive income (loss) attributable to noncontrolling interests TOTAL COMPREHENSIVE INCOME ATTRIBUTABLE TO SHAREOWNERS OF THE COCA-COLA COMPANY (3,959) (2,382) 142 357 (684) 714 86 (1,039) 2,951 4,774 (3) 21 (1,187) 151 (80) 1,066 8,576 39 $ 2,954 $ 4,753 $ 8,537 THE COCA-COLA COMPANY AND SUBSIDIARIES CONSOLIDATED BALANCE SHEETS 2015 2014 $ 8,958 9,052 18,010 3,665 4,466 3,100 3,066 679 December 31, (In millions except par value) ASSETS CURRENT ASSETS Cash and cash equivalents Short-term investments TOTAL CASH, CASH EQUIVALENTS AND SHORT-TERM INVESTMENTS Marketable securities Trade accounts receivable, less allowances of $352 and $331, respectively Inventories Prepaid expenses and other assets Assets held for sale TOTAL CURRENT ASSETS EQUITY METHOD INVESTMENTS OTHER INVESTMENTS OTHER ASSETS PROPERTY, PLANT AND EQUIPMENT net TRADEMARKS WITH INDEFINITE LIVES BOTTLERS' FRANCHISE RIGHTS WITH INDEFINITE LIVES GOODWILL OTHER INTANGIBLE ASSETS TOTAL ASSETS LIABILITIES AND EQUITY CURRENT LIABILITIES Accounts payable and accrued expenses Loans and notes payable Current maturities of long-term debt Accrued income taxes Liabilities held for sale TOTAL CURRENT LIABILITIES LONG-TERM DEBT OTHER LIABILITIES DEFERRED INCOME TAXES THE COCA-COLA COMPANY SHAREOWNERS' EQUITY Common stock, $0.25 par value; Authorized 11,200 shares; Issued 7,040 and 7,040 shares, respectively Capital surplus Reinvested earnings Accumulated other comprehensive income (loss) Treasury stock, at cost 2,716 and 2,674 shares, respectively EQUITY ATTRIBUTABLE TO SHAREOWNERS OF THE COCA-COLA COMPANY EQUITY ATTRIBUTABLE TO NONCONTROLLING INTERESTS TOTAL EQUITY TOTAL LIABILITIES AND EQUITY 7,309 8,322 15,631 4,269 3,941 2,902 2,752 3,900 33,395 12,318 3,470 4,207 12,571 5,989 6,000 11,289 854 $ 90,093 32,986 9,947 3,678 4,407 14,633 6,533 6,689 12,100 1,050 $ 92,023 $ 9,660 13,129 2,677 331 1,133 26,930 28,407 4,301 4,691 $ 9,234 19,130 3,552 400 58 32,374 19,063 4,389 5,636 1,760 14,016 65,018 (10,174) (45,066) 25,554 1,760 13,154 63,408 (5,777) (42,225 30,320 241 30,561 $ 92,023 210 25,764 $ 90,093 THE COCA-COLA COMPANY AND SUBSIDIARIES CONSOLIDATED STATEMENTS OF CASH FLOWS 2015 2014 2013 $ 7,366 1,970 236 73 (122) (137) (374) 929 744 (157) 10,528 $ 7,124 1,976 209 (40) (371) 415 831 761 149 $ 8,626 1,977 227 648 (201) 168 (670) 465 234 (932) 10,542 (439) 10,615 Year Ended December 31, (In millions) OPERATING ACTIVITIES Consolidated net income Depreciation and amortization Stock-based compensation expense Deferred income taxes Equity (income) loss net of dividends Foreign currency adjustments Significant (gains) losses on sales of assets net Other operating charges Other items Net change in operating assets and liabilities Net cash provided by operating activities INVESTING ACTIVITIES Purchases of investments Proceeds from disposals of investments Acquisitions of businesses, equity method investments and nonmarketable securities Proceeds from disposals of businesses, equity method investments and nonmarketable securities Purchases of property, plant and equipment Proceeds from disposals of property, plant and equipment Other investing activities Net cash provided by (used in) investing activities FINANCING ACTIVITIES Issuances of debt Payments of debt Issuances of stock Purchases of stock for treasury Dividends Other financing activities Net cash provided by (used in) financing activities EFFECT OF EXCHANGE RATE CHANGES ON CASH AND CASH EQUIVALENTS CASH AND CASH EQUIVALENTS Net increase (decrease) during the year Balance at beginning of year Balance at end of year (15,831) 14,079 (2,491) 565 (2,553) 85 (40) (6,186) (17,800) 12,986 (389) 148 (2,406) 223 (268) (7,506) (14,782) 12,791 (353) 872 (2,550) 111 (303) (4,214) 40,434 (37,738) 1,245 (3,564) (5,741) 251 (5,113) (878) 41,674 (36,962) 1,532 (4,162) (5,350) (363) (3,631) (934) 43,425 (38,714) 1,328 (4,832) (4,969) 17 (3,745 (611) (1,649) 8,958 $ 7,309 (1,456) 10,414 $ 8,958 1,972 8,442 $ 10,414 THE COCA-COLA COMPANY AND SUBSIDIARIES CONSOLIDATED STATEMENTS OF SHAREOWNERS' EQUITY 2015 2014 2013 4,366 (86) 44 4,402 4,469 (98) (121) 62 54 4,366 4,402 1,760 $ 1,760 4,324 1,760 $ 13,154 532 94 236 12,276 526 169 209 11,379 569 144 227 (43) 12,276 (26) 14,016 13,154 Year Ended December 31, (In millions except per share data) EQUITY ATTRIBUTABLE TO SHAREOWNERS OF THE COCA-COLA COMPANY NUMBER OF COMMON SHARES OUTSTANDING Balance at beginning of year Purchases of treasury stock Treasury stock issued to employees related to stock compensation plans Balance at end of year COMMON STOCK CAPITAL SURPLUS Balance at beginning of year Stock issued to employees related to stock compensation plans Tax benefit (charge) from stock compensation plans Stock-based compensation Other activities Balance at end of year REINVESTED EARNINGS Balance at beginning of year Net income attributable to shareowners of The Coca-Cola Company Dividends (per share $1.32, $1.22 and $1.12 in 2015, 2014 and 2013, respectively) Balance at end of year ACCUMULATED OTHER COMPREHENSIVE INCOME (LOSS) Balance at beginning of year Net other comprehensive income (loss) Balance at end of year TREASURY STOCK Balance at beginning of year Stock issued to employees related to stock compensation plans Purchases of treasury stock Balance at end of year TOTAL EQUITY ATTRIBUTABLE TO SHAREOWNERS OF THE COCA-COLA COMPANY EQUITY ATTRIBUTABLE TO NONCONTROLLING INTERESTS Balance at beginning of year Net income attributable to noncontrolling interests Net foreign currency translation adjustment Dividends paid to noncontrolling interests Acquisition of interests held by noncontrolling owners Contributions by noncontrolling interests Business combinations Deconsolidation of certain entities Other activities TOTAL EQUITY ATTRIBUTABLE TO NONCONTROLLING INTERESTS 63,408 7,351 (5,741) 65,018 61,660 7,098 (5,350) 63,408 58,045 8,584 (4,969) 61,660 (5,777) (4,397) (10,174) (3,432) (2,345) (5,777) (3,385) (47) (3,432) (42,225) (39,091) (35,009) 696 891 745 (3,537) (4,025) (4,827) (45,066) (42,225) (39,091) $ 25,554 $ 30,320 $ 33,173 $ $ 241 $ 15 (18) (31) 267 26 (5) (25) 378 42 (3) (58) (34) 6 25 (89) (3) ce 6 210 $ 241 $ 267
Step by Step Solution
There are 3 Steps involved in it

Get step-by-step solutions from verified subject matter experts