

Question: Financial Statement Analysis - Ratios, Identifying Issues, the Dupont Equation Company Financial Statements 0 Balance Sheets 2018-2020E 2020 2019 2018 $ 10 Assets 11 Cash
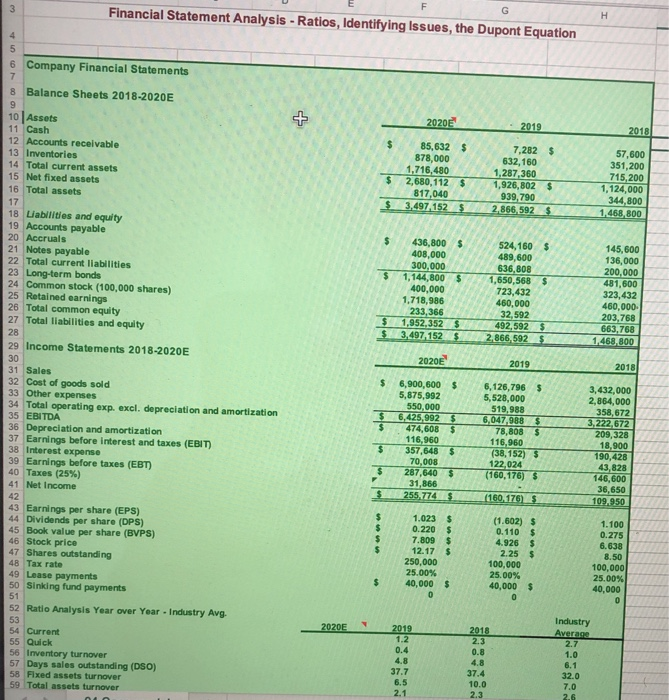
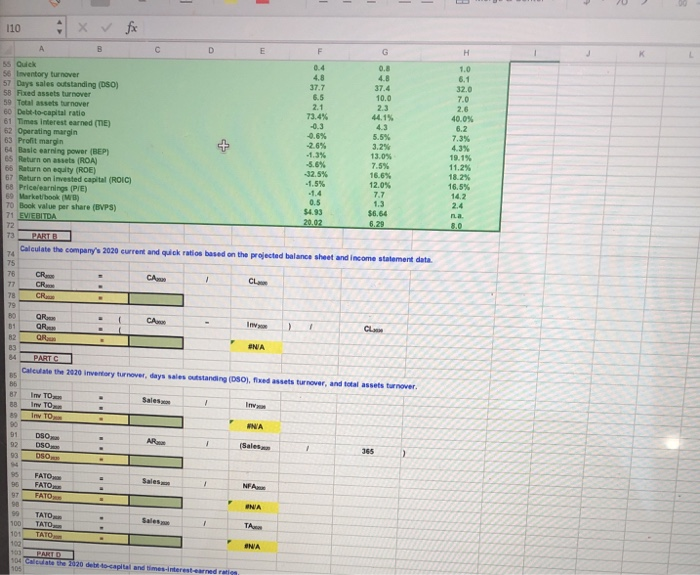
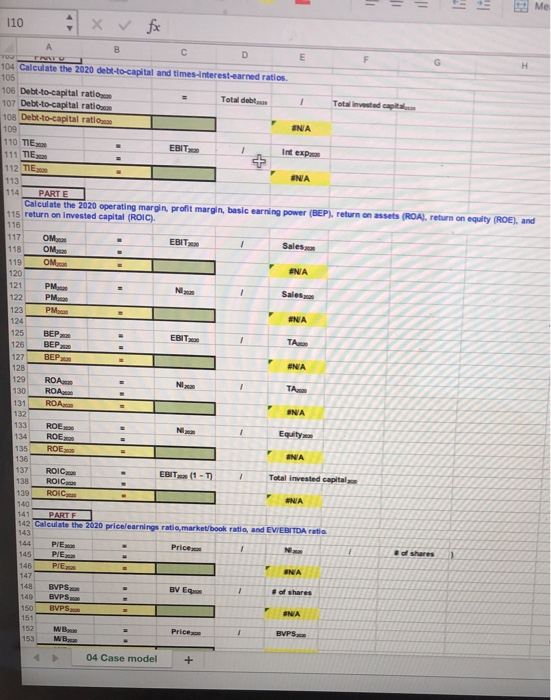
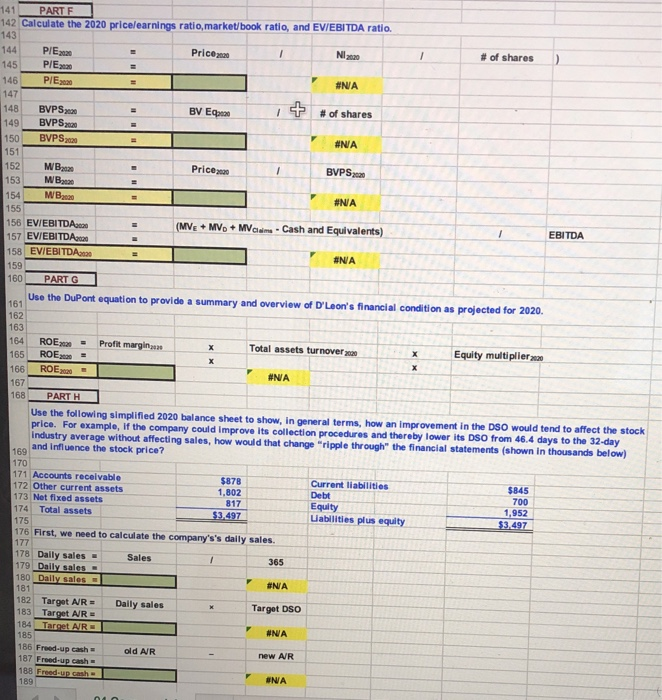
Financial Statement Analysis - Ratios, Identifying Issues, the Dupont Equation Company Financial Statements 0 Balance Sheets 2018-2020E 2020 2019 2018 $ 10 Assets 11 Cash 12 Accounts receivable 13 Inventories 14 Total current assets 15 Net fixed assets 16 Total assets $ $ 85,632 878,000 1.716,480 2.680,112 817.04.0 3,497152 $ 7,282 632,160 1.287.360 1.926.802 939,790 2.866, 592 $ 57,600 351,200 715,200 1.124.000 344,800 1.468,800 $ $ $ 18 Liabilities and equity 19 Accounts payable 20 Accruals 21 Notes payable Total current liabilities Long-term bonds 24 Common stock (100,000 shares) 25 Retained earnings 26 Total common equity 27 Total liabilities and equity $ 436,800S 408,000 300,000 1,144,800 400,000 1,718,986 231.366 1,952,3525 3,497152 $ 524,160 489,600 636,808 1,650,568 723,432 460,000 32,592 492,592 2.866,5925 145,600 136,000 200,000 481,600 323,432 460,000 203.768 663,768 468.800 $ $ Income Statements 2018-2020E 1 2020 2019 2018 $ $ $ $ Sales Cost of goods sold 33 Other expenses Total operating exp. excl. depreciation and amortization 35 EBITDA 36 Depreciation and amortization 37 Earnings before interest and taxes (EBIT) 38 Interest expense 39 Earnings before taxes (EBT) 40 Taxes (25%) 41 Net Income 42 43 Earnings per share (EPS) 44 Dividends per share (DPS) 45 Book value per share (BVPS) 46 Stock price 47 Shares outstanding 48 Tax rate 49 Lease payments 50 Sinking fund payments 6,900,600 5,875,992 550.000 6,425,992 474,608 116,960 357,648 70.008 287,640 31,866 255,774 6,126,796 5 5,528,000 519.988 6,047,988 $ 78,808 $ 116,960 (38,152) $ 122,024 (160,176) 3,432,000 2,864,000 358,672 3,222,672 209.328 18,900 190,428 43,828 146,600 36,650 109.950 $ $ (160,176) S 5 $ 1.100 1.023 0.220 7.809 12.17 250,000 25.00% 40,000 (1.602) 0.110 4.926 2.25 100,000 25.00% 40,000 0.275 6.638 8.50 100,000 25.00% 40,000 $ $ 52 Ratio Analysis Year over Year - Industry Avg. 2020E Industry Average 1.2 54 Current 55 Quick 56 Inventory turnover 57 Days sales outstanding (DSO) 58 Fixed assets turnover 59 Total assets turnover 0.4 4.8 37.7 6.5 0.8 37.4 4.8 10.0 2.3 110 x fx 37.7 32.0 37.4 10.0 es 21 73.4% 15 4.3 5.5% -1.6% -25% ventory turnover 57 Days sales outstanding (050) 58 Faxed assets turnover Total turnover 50 Debt-to-capital ratio 61 Times interest earned (TE) 62 Operating margin 3 Profit margin 54 Basic earning power (BE) 65 Return on asets (ROA) 66 Raturn on equity (ROE) 67 Return on invested capital (ROIC) 58 Pricelearnings (PE) Market/bock (MB) 70 Book value per share (BVPS) 71 EVIEBITDA 40.0% 6.2 7.3% 4.3% 10.15 11.25 18.2% -5.6% 32.5% -1.5 13.0% 7.5%. 16.6% 12.0% 7.7 1.3 $0.64 16 0.5 $4.93 Calculate the company's 2020 current and quick ratios based on the projected balance sheet and income statement data CAL CR CR. CR - CA Inv ) QR OR Calathe 2020 inventory turnover days we outstanding (OSOL w a s turnover, and assets turnover BT 8 I TO in TO DSO Sales FATOS FATO NFA TATO the 1020 lande t 110 x fx ENA 104 Calculate the 2020 debt-to-capital and times-interest-earned ratios. 105 106 Debt-to-capital rati tal ratio = Total debt Total debluse 107 Debt-to-capital ratio Totalled capital 108 Debt-to-capital ratio 109 110 TIE- EBIT Intex 111 TIE - 112 TIE ANA 113 114 PARTE Calculate the 2020 operating margin, profit margin, basic earning power (BEP), return on assets (ROAI return on equity (ROE), and 115 return on invested capital (ROIC). 116 117 118 119 EBIT = OM OM OM. Sales = PM PM PM. Sales #NA EBIT BEP BEP BEP ANA ROA ROA ROA ROES ROE ROE Equity ENA - ROIC ROIC ROIC EBIT (1 - 1) Total invested capital 139 141 PARTE 142 Calculate the 2020 pricelearnings ratio,market book ratio, and EVIEBITDA ratio Price PIE PE PIE of shares 145 146 ) BV E. of shares 143 149 150 BVPS BVPS HVPS 152 153 MB MB Price BVPS 4 04 Case model + 1 PARTE 2 Calculate the 2020 pricelearnings ratio,market/book ratio, and EV/EBITDA ratio NI # of shares Price 14 5 PIE220 PIE PIE. INA BV EQ + # of shares BVPS BVPS2020 BVPS ANA Price BVPS 51 152 153 154 MB2020 MB MB ENA 155 (MVE + MV + MV Claim - Cash and Equivalents) EBITDA 156 EVIEBITDA 157 EVIEBITDA 158 EVIEBITDA2020 = 159 160PARTG Use the DuPont equation to provide a summary and overview of D' Leon's financial condition as projected for 2020 162 164 ROE3.20 - Profit margin X Total assets turnover 220 Equity multiplier 220 165 ROE 166 ROE. = ANA 167 168 PARTH Use the following simplified 2020 balance sheet to show, in general terms, how an improvement in the DSO would tend to affect the stock price. For example, if the company could improve its collection procedures and thereby lower its DSO from 46.4 days to the 32-day Industry average without affecting sales, how would that change "ripple through the financial statements (shown in thousands below) 169 and influence the stock price? 170 $845 Current liabilities Debt Equity Uabilities plus equity 1,952 $3.497 365 171 Accounts receivable $878 172 Other current assets 1.802 173 Net fixed assets 817 174 Total assets $3.497 175 176 First, we need to calculate the company's's daily sales. 177 178 Daily sales - Sales 179 Daily sales - 180 Daily sales INA 181 182 Target AR - Daily sales Target DSO 183 Target AR- 184 Target AR NA 185 186 Freed-up cash old AR new AR 187 Freed-up cash 188 Freed-up cash ONA 189 Financial Statement Analysis - Ratios, Identifying Issues, the Dupont Equation Company Financial Statements 0 Balance Sheets 2018-2020E 2020 2019 2018 $ 10 Assets 11 Cash 12 Accounts receivable 13 Inventories 14 Total current assets 15 Net fixed assets 16 Total assets $ $ 85,632 878,000 1.716,480 2.680,112 817.04.0 3,497152 $ 7,282 632,160 1.287.360 1.926.802 939,790 2.866, 592 $ 57,600 351,200 715,200 1.124.000 344,800 1.468,800 $ $ $ 18 Liabilities and equity 19 Accounts payable 20 Accruals 21 Notes payable Total current liabilities Long-term bonds 24 Common stock (100,000 shares) 25 Retained earnings 26 Total common equity 27 Total liabilities and equity $ 436,800S 408,000 300,000 1,144,800 400,000 1,718,986 231.366 1,952,3525 3,497152 $ 524,160 489,600 636,808 1,650,568 723,432 460,000 32,592 492,592 2.866,5925 145,600 136,000 200,000 481,600 323,432 460,000 203.768 663,768 468.800 $ $ Income Statements 2018-2020E 1 2020 2019 2018 $ $ $ $ Sales Cost of goods sold 33 Other expenses Total operating exp. excl. depreciation and amortization 35 EBITDA 36 Depreciation and amortization 37 Earnings before interest and taxes (EBIT) 38 Interest expense 39 Earnings before taxes (EBT) 40 Taxes (25%) 41 Net Income 42 43 Earnings per share (EPS) 44 Dividends per share (DPS) 45 Book value per share (BVPS) 46 Stock price 47 Shares outstanding 48 Tax rate 49 Lease payments 50 Sinking fund payments 6,900,600 5,875,992 550.000 6,425,992 474,608 116,960 357,648 70.008 287,640 31,866 255,774 6,126,796 5 5,528,000 519.988 6,047,988 $ 78,808 $ 116,960 (38,152) $ 122,024 (160,176) 3,432,000 2,864,000 358,672 3,222,672 209.328 18,900 190,428 43,828 146,600 36,650 109.950 $ $ (160,176) S 5 $ 1.100 1.023 0.220 7.809 12.17 250,000 25.00% 40,000 (1.602) 0.110 4.926 2.25 100,000 25.00% 40,000 0.275 6.638 8.50 100,000 25.00% 40,000 $ $ 52 Ratio Analysis Year over Year - Industry Avg. 2020E Industry Average 1.2 54 Current 55 Quick 56 Inventory turnover 57 Days sales outstanding (DSO) 58 Fixed assets turnover 59 Total assets turnover 0.4 4.8 37.7 6.5 0.8 37.4 4.8 10.0 2.3 110 x fx 37.7 32.0 37.4 10.0 es 21 73.4% 15 4.3 5.5% -1.6% -25% ventory turnover 57 Days sales outstanding (050) 58 Faxed assets turnover Total turnover 50 Debt-to-capital ratio 61 Times interest earned (TE) 62 Operating margin 3 Profit margin 54 Basic earning power (BE) 65 Return on asets (ROA) 66 Raturn on equity (ROE) 67 Return on invested capital (ROIC) 58 Pricelearnings (PE) Market/bock (MB) 70 Book value per share (BVPS) 71 EVIEBITDA 40.0% 6.2 7.3% 4.3% 10.15 11.25 18.2% -5.6% 32.5% -1.5 13.0% 7.5%. 16.6% 12.0% 7.7 1.3 $0.64 16 0.5 $4.93 Calculate the company's 2020 current and quick ratios based on the projected balance sheet and income statement data CAL CR CR. CR - CA Inv ) QR OR Calathe 2020 inventory turnover days we outstanding (OSOL w a s turnover, and assets turnover BT 8 I TO in TO DSO Sales FATOS FATO NFA TATO the 1020 lande t 110 x fx ENA 104 Calculate the 2020 debt-to-capital and times-interest-earned ratios. 105 106 Debt-to-capital rati tal ratio = Total debt Total debluse 107 Debt-to-capital ratio Totalled capital 108 Debt-to-capital ratio 109 110 TIE- EBIT Intex 111 TIE - 112 TIE ANA 113 114 PARTE Calculate the 2020 operating margin, profit margin, basic earning power (BEP), return on assets (ROAI return on equity (ROE), and 115 return on invested capital (ROIC). 116 117 118 119 EBIT = OM OM OM. Sales = PM PM PM. Sales #NA EBIT BEP BEP BEP ANA ROA ROA ROA ROES ROE ROE Equity ENA - ROIC ROIC ROIC EBIT (1 - 1) Total invested capital 139 141 PARTE 142 Calculate the 2020 pricelearnings ratio,market book ratio, and EVIEBITDA ratio Price PIE PE PIE of shares 145 146 ) BV E. of shares 143 149 150 BVPS BVPS HVPS 152 153 MB MB Price BVPS 4 04 Case model + 1 PARTE 2 Calculate the 2020 pricelearnings ratio,market/book ratio, and EV/EBITDA ratio NI # of shares Price 14 5 PIE220 PIE PIE. INA BV EQ + # of shares BVPS BVPS2020 BVPS ANA Price BVPS 51 152 153 154 MB2020 MB MB ENA 155 (MVE + MV + MV Claim - Cash and Equivalents) EBITDA 156 EVIEBITDA 157 EVIEBITDA 158 EVIEBITDA2020 = 159 160PARTG Use the DuPont equation to provide a summary and overview of D' Leon's financial condition as projected for 2020 162 164 ROE3.20 - Profit margin X Total assets turnover 220 Equity multiplier 220 165 ROE 166 ROE. = ANA 167 168 PARTH Use the following simplified 2020 balance sheet to show, in general terms, how an improvement in the DSO would tend to affect the stock price. For example, if the company could improve its collection procedures and thereby lower its DSO from 46.4 days to the 32-day Industry average without affecting sales, how would that change "ripple through the financial statements (shown in thousands below) 169 and influence the stock price? 170 $845 Current liabilities Debt Equity Uabilities plus equity 1,952 $3.497 365 171 Accounts receivable $878 172 Other current assets 1.802 173 Net fixed assets 817 174 Total assets $3.497 175 176 First, we need to calculate the company's's daily sales. 177 178 Daily sales - Sales 179 Daily sales - 180 Daily sales INA 181 182 Target AR - Daily sales Target DSO 183 Target AR- 184 Target AR NA 185 186 Freed-up cash old AR new AR 187 Freed-up cash 188 Freed-up cash ONA 189
Step by Step Solution
There are 3 Steps involved in it

Get step-by-step solutions from verified subject matter experts