

Question: Financial Statement Analysis Set-up like the Historical Income Statements, this worksheet should use formulas to calculate the common sized percentages, linking to the Historical Income
Financial Statement Analysis
- Set-up like the Historical Income Statements, this worksheet should use formulas to calculate the common sized percentages, linking to the Historical Income Statements for the calculations. Revenue or Total Revenue (depending on your company) should be used as the base for all common sized calculations on the Income Statements. Common sized percentages should be calculated for all three historical years presented.
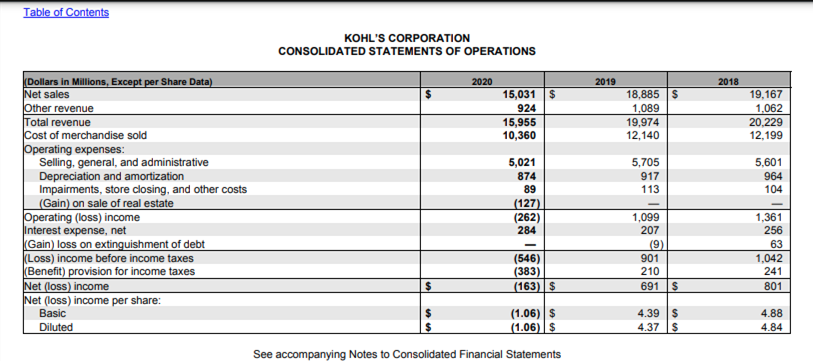
Table of Contents KOHL'S CORPORATION CONSOLIDATED STATEMENTS OF OPERATIONS 2019 2018 2020 15,0315 924 15,955 10,360 18,885 $ 1,089 19,974 12,140 19.167 1,062 20,229 12,199 5,021 874 5,705 917 113 5,601 964 104 (Dollars in Millions, Except per Share Data) Net sales Other revenue Total revenue Cost of merchandise sold Operating expenses: Selling, general, and administrative Depreciation and amortization Impairments, store closing, and other costs (Gain) on sale of real estate Operating (loss) income Interest expense, net Gain) loss on extinguishment of debt (Loss) income before income taxes (Benefit) provision for income taxes Net (loss) income Net (loss) income per share: Basic Diluted 89 (127) (262) 284 1,099 207 (9) 901 210 691 1,361 256 63 1,042 241 801 (546) (383) (163) $ (1.06) $ (1.06) $ 4.39 $ 4.37 s 4.88 4.84 See accompanying Notes to Consolidated Financial Statements
Step by Step Solution
There are 3 Steps involved in it

Get step-by-step solutions from verified subject matter experts