

Question: FINANCIAL STATEMENT ANALYSIS SPREADSHEET PROJECT Project is due April 22 Directions: The purpose of this project is to learn how to analysis a company using
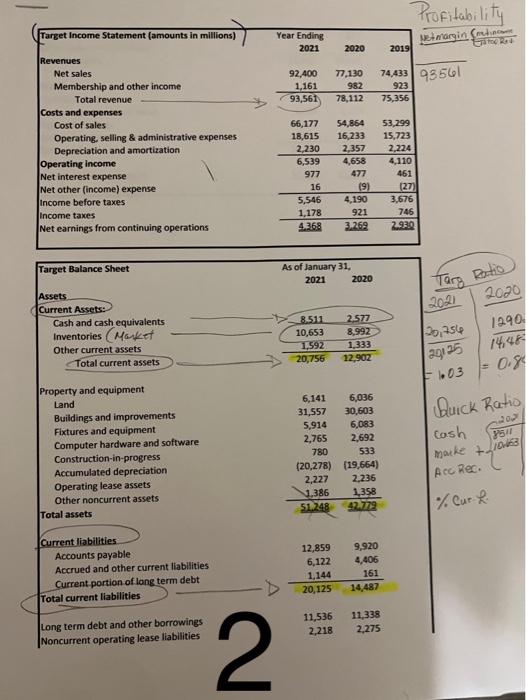
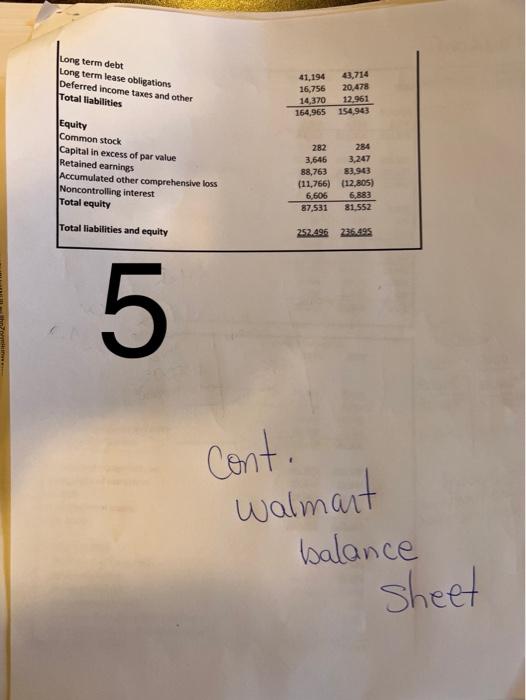
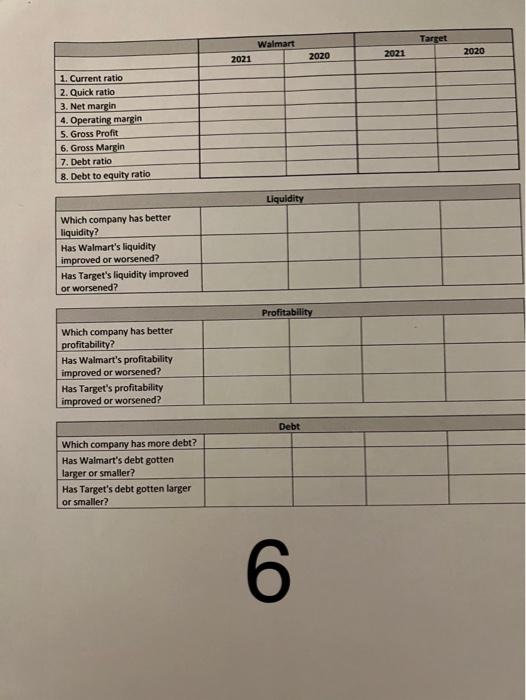
FINANCIAL STATEMENT ANALYSIS SPREADSHEET PROJECT Project is due April 22 Directions: The purpose of this project is to learn how to analysis a company using ratios. Open the spreadsheet called Financial Analysis Project Spreadsheet in Week 14 module. There are two tabs in the spreadsheet labeled Waimart Financials and Target Financials. You will place your answers on the word file called Student Template for Answers. That will be the file you submit in the Financial Analysis Drop Box. Calculate the following ratios for both Target and Waimart for 2021 and 2020: Liquidity 1. Current Ratio (current assets / current lliabilities) 2. Quick Ratio ((cash + marketable securities + accounts receivable)/ current liabilities) Profitability 3. Net Margin (net income / total revenue) 4. Operating margin (operating income / total revenue) 5. Gross Profit (sales - cost of sales) 6. Gross Margin (gross profit/ sales) Debit 1. Debt Ratio (total debt (liabilities)/total assets) 2. Debt to equity Ratio (total debt (liabilities) / total equity) Additional Notes 1. Comment on which company has better liquidity, better profitability, and less debt. 2. Comment on whether each company has improved or worsened its liquidity, profitability, and debt. Revenues Net sales Membership and other income Total revenue Costs and expenses \begin{tabular}{rrr|} 1,161 & 982 & 923 \\ \hline 93,561 & 78,112 & 75,356 \\ \hline \end{tabular} Cost of sales Operating, selling & administrative expenses Depreciation and amortization Operating income Net interest expense Net other (income) expense Income before taxes Income taxes Net earnings from continuing operations \begin{tabular}{rrr|} 66,177 & 54,864 & 53,299 \\ 18,615 & 16,233 & 15,723 \\ 2,230 & 2,357 & 2,224 \\ \hline 6,539 & 4,658 & 4,110 \\ 977 & 477 & 461 \\ 16 & (9) & {[27)} \\ \hline 5,546 & 4,190 & 3,676 \\ 1,178 & 921 & 746 \\ \hline 4,368 & 3,269 & 2,939 \\ \hline \end{tabular} Target Balance Sheet As of January 31 , 20212020 Assets. Current Assets: Cash and cash equivalents Inventories (MGicet Other current assets Total current assets 2017512901.03=14.81.48 Property and equipment Land Buildings and improvements Fixtures and equipment Computer hardware and software Construction-in-progress Accumulated depreciation Ratick Ratio cosh romi manke +hous Acc Res. Operating lease assets Other noncurrent assets Total assets \begin{tabular}{rr} 6,141 & 6,036 \\ 31,557 & 30,603 \\ 5,914 & 6,083 \\ 2,765 & 2,692 \\ 780 & 533 \\ {20,278} & {19,664} \\ 2,227 & 2,236 \\ 3,386 & 1,358 \\ \hline 51,248 & 42779 \\ \hline \end{tabular} =/6 Cur Current liabilities Accounts payable Accrued and other current liabilities Current portion of long term debt Total current liabilities Long term debt and other borrowings Noncurrent operating lease liabilities (TantbalanceSheet)Target 4 cont. walmant balance sheet 6
Step by Step Solution
There are 3 Steps involved in it

Get step-by-step solutions from verified subject matter experts