

Question: Financial Table: Horizontal Analysis Table 1) Do a Horizontal Analysis Table from the year 2013 through 2017 for Cold Stone (table #1) and Ben &
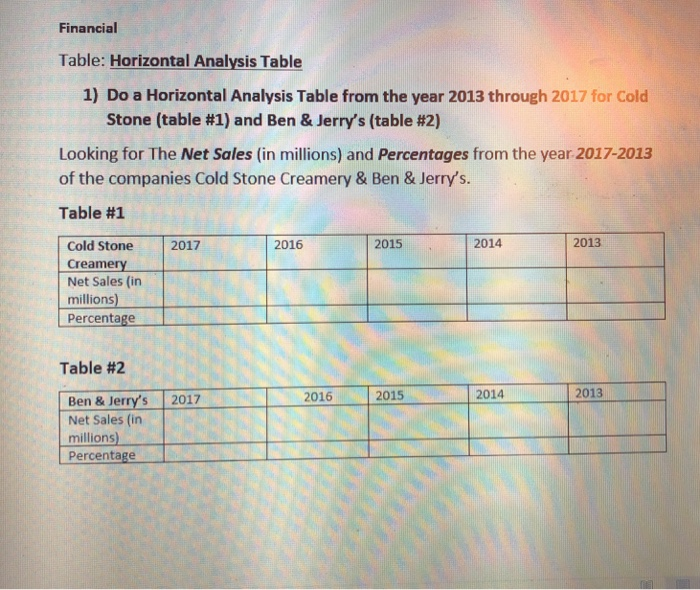
Financial Table: Horizontal Analysis Table 1) Do a Horizontal Analysis Table from the year 2013 through 2017 for Cold Stone (table #1) and Ben & Jerry's (table #2) Looking for The Net Sales (in millions) and Percentages from the year 2017-2013 of the companies Cold Stone Creamery & Ben & Jerry's Table #1 Cold Stone2017 2016 2015 2014 2013 Creame Net Sales (in millions) Percentage ry Table #2 2015 2014 2013 Ben& Jerry's 2017 Net Sales (in millions)- Percentage 2016 Financial Table: Horizontal Analysis Table 1) Do a Horizontal Analysis Table from the year 2013 through 2017 for Cold Stone (table #1) and Ben & Jerry's (table #2) Looking for The Net Sales (in millions) and Percentages from the year 2017-2013 of the companies Cold Stone Creamery & Ben & Jerry's Table #1 Cold Stone2017 2016 2015 2014 2013 Creame Net Sales (in millions) Percentage ry Table #2 2015 2014 2013 Ben& Jerry's 2017 Net Sales (in millions)- Percentage 2016
Step by Step Solution
There are 3 Steps involved in it

Get step-by-step solutions from verified subject matter experts