

Question: FINANCIAL TIME SERIES 147 g pric b. Using the mean and standard deviation, how 40 30 20 might you estimate the chance that stock in
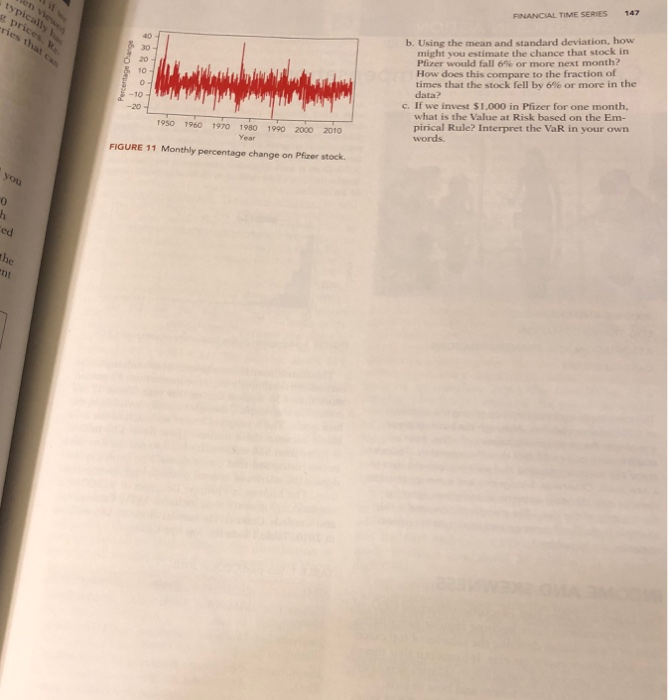
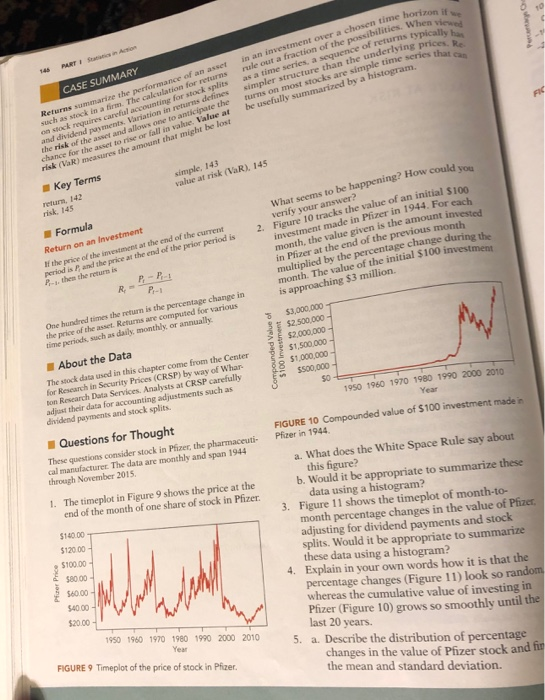
FINANCIAL TIME SERIES 147 g pric b. Using the mean and standard deviation, how 40 30 20 might you estimate the chance that stock in Pfizer would fall 6% or more next month? How does times that the stock fell by 6% or more in the this compare to the fraction of 10 a-10 -20 c. If we invest $1,000 in Pfizer for one month, what is the Value at Risk based on the Em- pirical Rule? Interpret the VaR in your own words 1950 1960 1970 1980 1990 2000 2010 FIGURE 11 Monthly percentage change on Pfizer stock you 0 ed nt Returns summarize the performance of an asset in an investment over a chosen time hori such as stock in a firm. The calculation for returns rule out a fraction of the possibilities, whe- i 148 PARTStatcs in Action on ssock requires carefal accounting for stock splits as a time series, a sequence of returns typicall and dividend payments, Variation in returns defines simpler structure than the underlying pric the risk of the asset and allows one to anticinate the turns on most stocks are simple time series Re chance for the asset to rise or fall in value. Vaue at be usefully summarized by a histogram,an risk (VaR) measures the amount that might be lost CASE SUMMARY that can Key Terms simple, 143 value at risk (VaR). 145 retum, 142 risk, 145 Formula Return on an Investment If the price of the investment -1, then the return is What seems to be happening? How could yo 2. Figure 10 tracks the value of an initial S100 de in Pfizer in 1944. For each verify your answer? at the end of the current investment ma month, the value given is the amount invested in Pfizer at the end of the previous month multiplied by the percentage change during the month. The value of the initial $100 investment is approaching $3 million. geriod is P and the price at the end of the prior period is One hundred times the return is the percentage change in the price of the asset. Returns are computed for various time periods, such as daily, monthly, or annually About the Data The stock data used in this chapter for Rescarch in Security Prices (CRSP) by way of Whar $3,000,000 $2,500,000 $2,000,000 $1,500,000 $1,000,000 come from the Center on Research Data Services. Analysts at CRSP adjust their data for accounting adjustments such as carefulhy $500,000 $0 payments and stock splits 1950 1960 1970 1980 1990 2000 2010 Year Questions for Thought 0 Compounded value of $100 investment made in These questions consider stock in Pfizer, the pharmaceuti- Pfizer in 1944 cal manufacturer. The data are monthly and span 1944 through November 2015. a. What does the White Space Rule say about this figure? b. Would it be appropriate to summarize these 1. The timeplot in Figure 9 shows the price at the end of the month of one share of stock in Pfizer 140.00 120.00 100.00 $8000 $60.00 40.00 $20.00 data using a histogram? Figure 11 shows the timeplot of month-to- month percentage changes in the value of Pfizer adjusting for dividend payments and stock splits. Would it be appropriate to summarize these data using a histogram? Explain in your own words how it is that the percentage changes (Figure 11) look so random whereas the cumulative value of investing in 3. 4. 1950 1960 1970 1980 1990 2000 2010 5. a. Describe the distribution of percentage Pfizer (Figure 10) grows so smoothly until the last 20 years. FIGURE 9 Timeplot of the price of stock in Pfizer. Year changes in the value of Pfizer stock and fin the mean and standard deviation. FINANCIAL TIME SERIES 147 g pric b. Using the mean and standard deviation, how 40 30 20 might you estimate the chance that stock in Pfizer would fall 6% or more next month? How does times that the stock fell by 6% or more in the this compare to the fraction of 10 a-10 -20 c. If we invest $1,000 in Pfizer for one month, what is the Value at Risk based on the Em- pirical Rule? Interpret the VaR in your own words 1950 1960 1970 1980 1990 2000 2010 FIGURE 11 Monthly percentage change on Pfizer stock you 0 ed nt Returns summarize the performance of an asset in an investment over a chosen time hori such as stock in a firm. The calculation for returns rule out a fraction of the possibilities, whe- i 148 PARTStatcs in Action on ssock requires carefal accounting for stock splits as a time series, a sequence of returns typicall and dividend payments, Variation in returns defines simpler structure than the underlying pric the risk of the asset and allows one to anticinate the turns on most stocks are simple time series Re chance for the asset to rise or fall in value. Vaue at be usefully summarized by a histogram,an risk (VaR) measures the amount that might be lost CASE SUMMARY that can Key Terms simple, 143 value at risk (VaR). 145 retum, 142 risk, 145 Formula Return on an Investment If the price of the investment -1, then the return is What seems to be happening? How could yo 2. Figure 10 tracks the value of an initial S100 de in Pfizer in 1944. For each verify your answer? at the end of the current investment ma month, the value given is the amount invested in Pfizer at the end of the previous month multiplied by the percentage change during the month. The value of the initial $100 investment is approaching $3 million. geriod is P and the price at the end of the prior period is One hundred times the return is the percentage change in the price of the asset. Returns are computed for various time periods, such as daily, monthly, or annually About the Data The stock data used in this chapter for Rescarch in Security Prices (CRSP) by way of Whar $3,000,000 $2,500,000 $2,000,000 $1,500,000 $1,000,000 come from the Center on Research Data Services. Analysts at CRSP adjust their data for accounting adjustments such as carefulhy $500,000 $0 payments and stock splits 1950 1960 1970 1980 1990 2000 2010 Year Questions for Thought 0 Compounded value of $100 investment made in These questions consider stock in Pfizer, the pharmaceuti- Pfizer in 1944 cal manufacturer. The data are monthly and span 1944 through November 2015. a. What does the White Space Rule say about this figure? b. Would it be appropriate to summarize these 1. The timeplot in Figure 9 shows the price at the end of the month of one share of stock in Pfizer 140.00 120.00 100.00 $8000 $60.00 40.00 $20.00 data using a histogram? Figure 11 shows the timeplot of month-to- month percentage changes in the value of Pfizer adjusting for dividend payments and stock splits. Would it be appropriate to summarize these data using a histogram? Explain in your own words how it is that the percentage changes (Figure 11) look so random whereas the cumulative value of investing in 3. 4. 1950 1960 1970 1980 1990 2000 2010 5. a. Describe the distribution of percentage Pfizer (Figure 10) grows so smoothly until the last 20 years. FIGURE 9 Timeplot of the price of stock in Pfizer. Year changes in the value of Pfizer stock and fin the mean and standard deviation
Step by Step Solution
There are 3 Steps involved in it

Get step-by-step solutions from verified subject matter experts