

Question: Find all z-scores for the X distribution. Identify all data points that are considered outliers based on the following definition: Z is greater than or
Find all z-scores for the X distribution. Identify all data points that are considered outliers based on the following definition: Z is greater than or equal to 3. How does this method of identifying outliers relate to the "Quartile Method (i.e., did the methods identify the same outliers)? Create a scatterplot. Be sure to put "Satisfaction with Life" (Y) on the y-axis and "Perception of Meaning in Life" (X) on the x-axis. Do you think there is a negative, positive, or no relationship between these variables? Be sure to provide evidence for your conclusion. Calculate the correlation between the X and Y distributions. Be sure to provide a complete interpretation. That is, indicate the direction (i.e., positive, negative, or no relationship), the size (i.e., .1 = small; .3 = medium; .5 = large), and define what the correlation means in the context of these two variables. Create a regression equation to predict "Satisfaction with Life" (Y) from "Perception of Meaning in Life" (X). Be sure to provide a complete interpretation of the y-intercept and slope. If an undergraduate scored a 3 on "Perception of Meaning in Life" what would be his/her predicted score on the "Satisfaction with Life?"
Last question is Add the appropriate regression line to the scatterplot created in question #8. Be sure to label all necessary components (e.g., note the equation)
13. Add the appropriate regression line to the scatterplot created in question #8. Be sure to label all necessary components (e.g., note the equation).
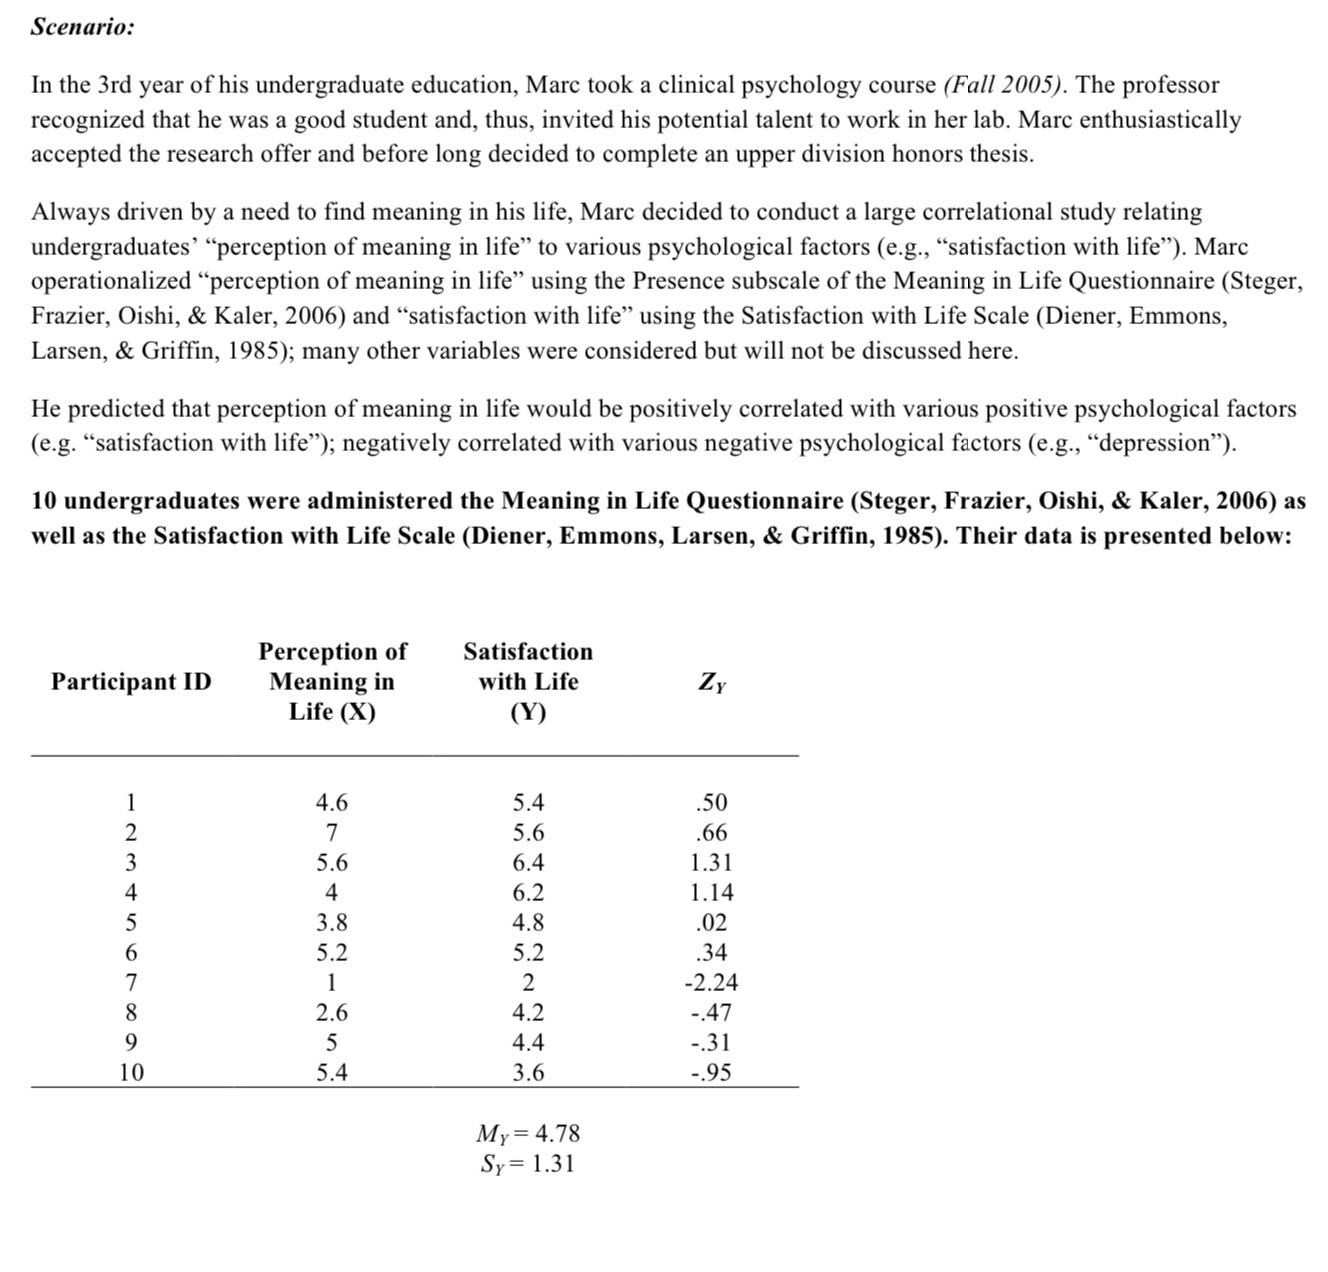
Scenario: In the 3rd year of his undergraduate education, Marc took a clinical psychology course (Fall 2005). The professor recognized that he was a good student and, thus, invited his potential talent to work in her lab. Marc enthusiastically accepted the research offer and before long decided to complete an upper division honors thesis. Always driven by a need to find meaning in his life, Marc decided to conduct a large correlational study relating undergraduates' "perception of meaning in life" to various psychological factors (e.g., "satisfaction with life"). Marc operationalized "perception of meaning in life" using the Presence subscale of the Meaning in Life Questionnaire (Steger, Frazier, Oishi, & Kaler, 2006) and "satisfaction with life" using the Satisfaction with Life Scale (Diener, Emmons, Larsen, & Griffin, 1985); many other variables were considered but will not be discussed here. He predicted that perception of meaning in life would be positively correlated with various positive psychological factors (e.g. "satisfaction with life"); negatively correlated with various negative psychological factors (e.g., "depression"). 10 undergraduates were administered the Meaning in Life Questionnaire (Steger, Frazier, Oishi, & Kaler, 2006) as well as the Satisfaction with Life Scale (Diener, Emmons, Larsen, & Griffin, 1985). Their data is presented below: Perception of Satisfaction Participant ID Meaning in with Life Zy Life (X) (Y) 4.6 5.4 .50 J 5.6 .66 5.6 6.4 1.31 A 6.2 1.14 .8 4.8 02 OOO VaVIA WN- 5.2 5.2 .34 2 -2.24 2.6 4.2 ..47 4.4 -.31 3.6 -.95 My = 4.78 Sy = 1.31
Step by Step Solution
There are 3 Steps involved in it

Get step-by-step solutions from verified subject matter experts