

Question: Find lower and upper bounds for the area between the x-axis and the graph of f(x) = x + 3 over the interval [0,
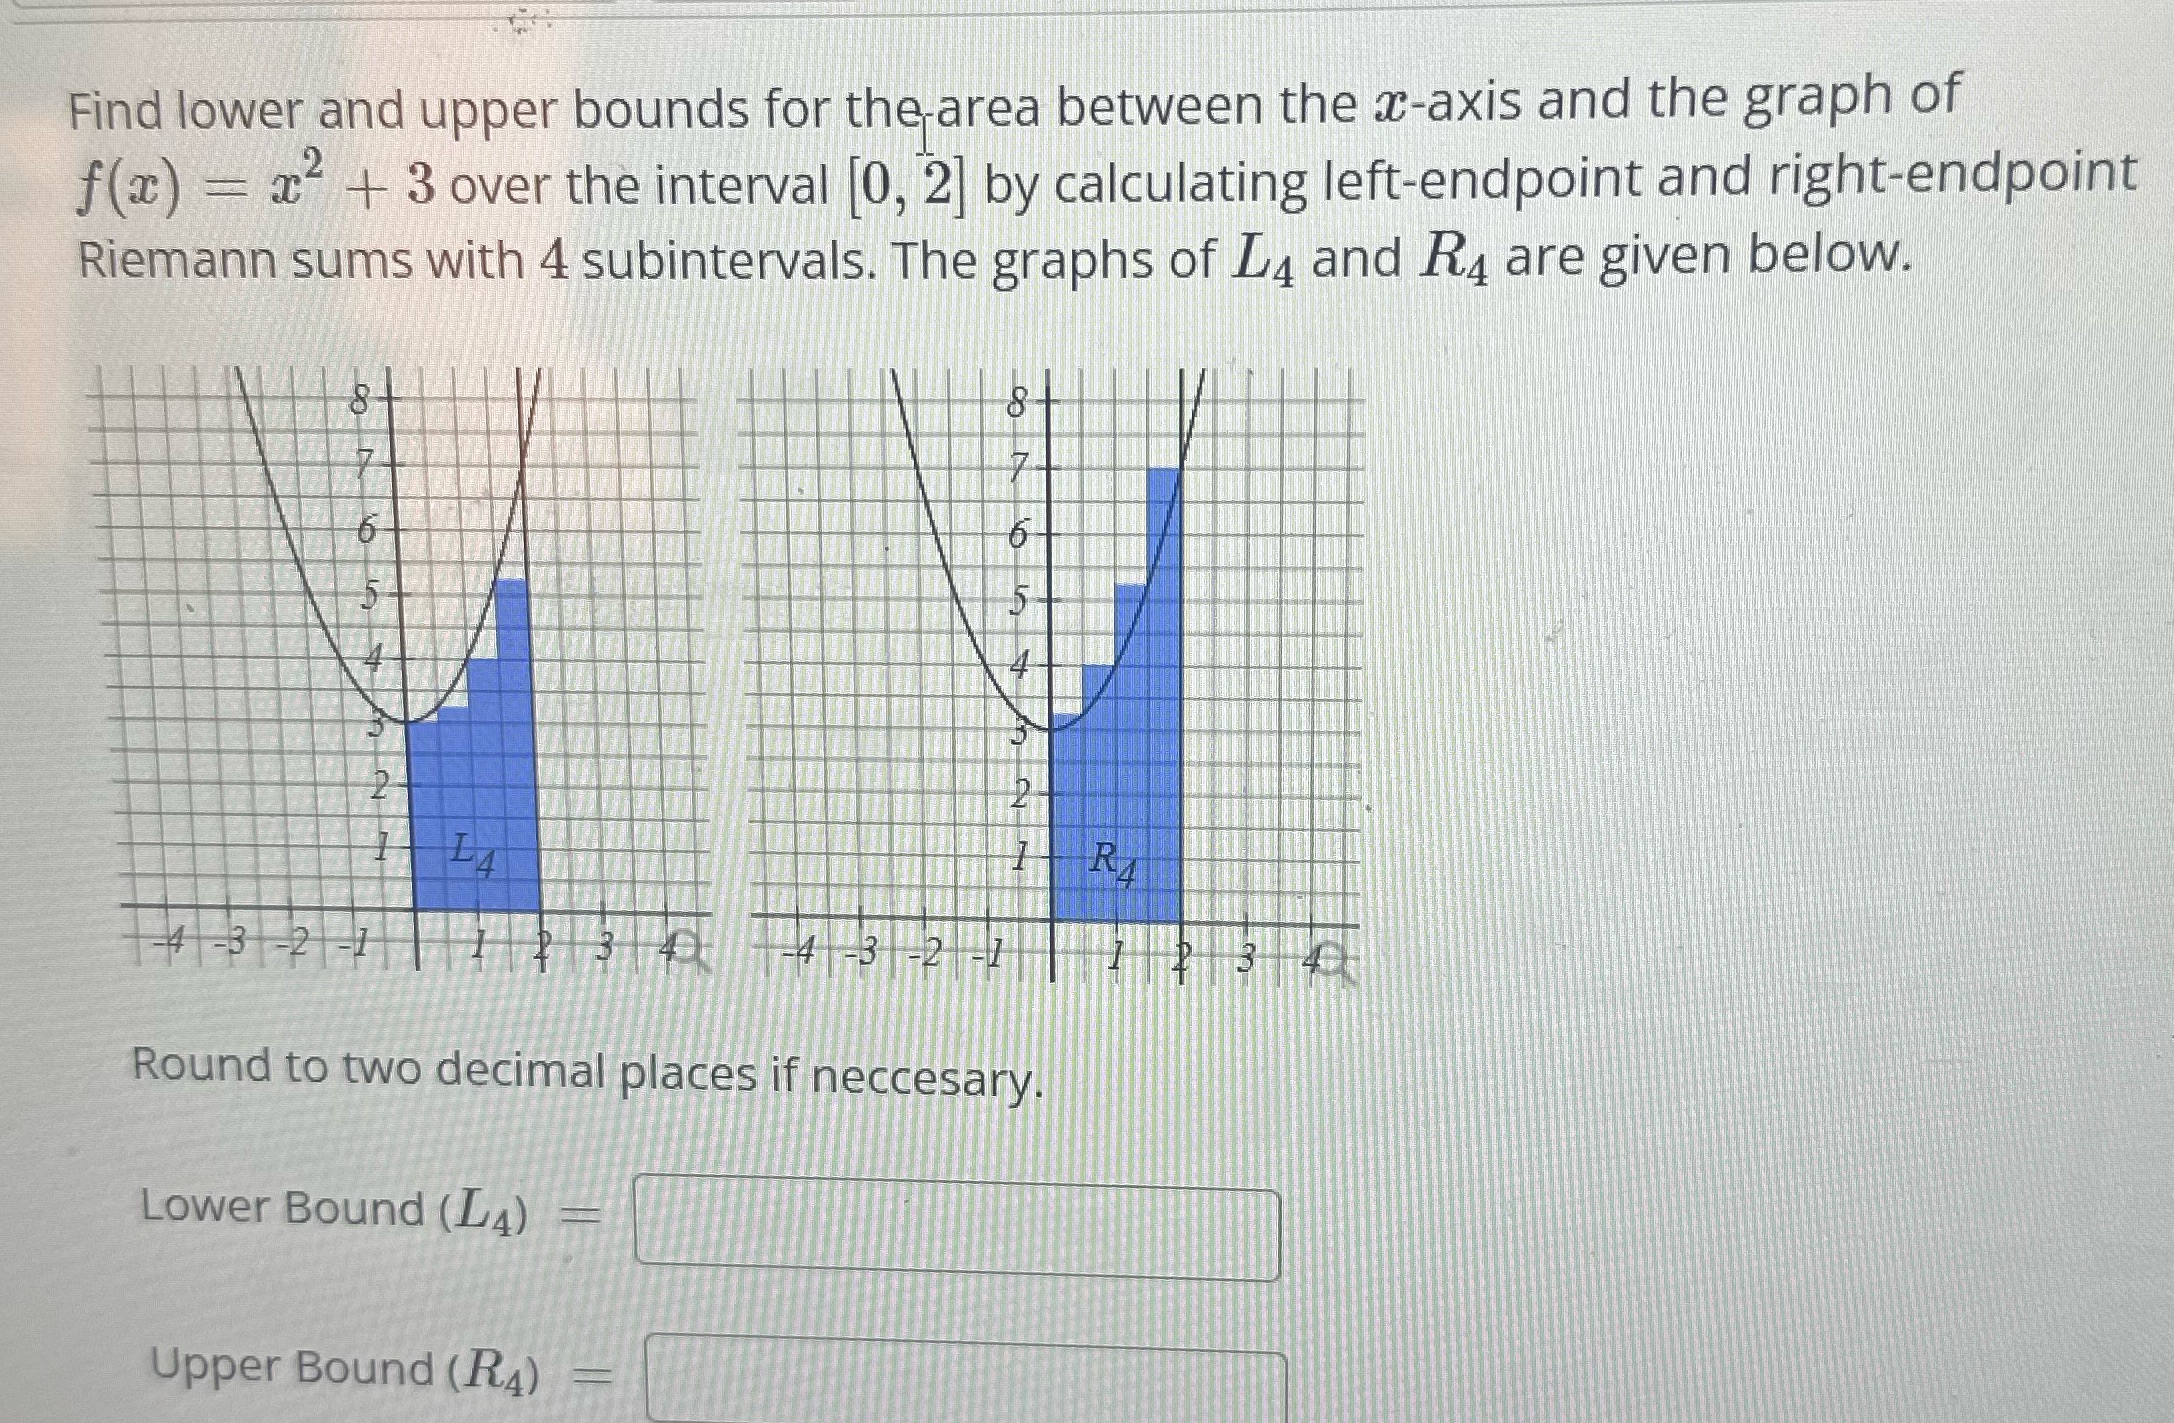
Find lower and upper bounds for the area between the x-axis and the graph of f(x) = x + 3 over the interval [0, 2] by calculating left-endpoint and right-endpoint Riemann sums with 4 subintervals. The graphs of L4 and R4 are given below. N 8 5 2- + 4-3-2-1 14 Lower Bound (LA) 2 3 4 5 -4-3-2-1 8 7 6 5- 4 Round to two decimal places if neccesary. Upper Bound (R4) EVE 2- 1 RA $34
Step by Step Solution
★★★★★
3.45 Rating (158 Votes )
There are 3 Steps involved in it
1 Expert Approved Answer
Step: 1 Unlock

To find the lower and upper bounds for the area between the xaxis and the graph of fx x2 3 over the ... View full answer
Question Has Been Solved by an Expert!
Get step-by-step solutions from verified subject matter experts
Step: 2 Unlock
Step: 3 Unlock