

Question: MTH130 Module 4 - Section Assignment 6.3 (Homework) Answer ALL the following question above: Please also make sure that your hand writing is clear and
![and readable, thank you! 1. [-/1 Points] DETAILS TANAPCALC10 6.3.002. 0/4 Submissions](https://s3.amazonaws.com/si.experts.images/answers/2024/06/6660eeb062edd_5926660eeb052c78.jpg)


MTH130 Module 4 - Section Assignment 6.3 (Homework)
Answer ALL the following question above: Please also make sure that your hand writing is clear and readable, thank you!
![Help? Read It Watch It2. [-/1 Points] DETAILS TANAPCALC10 6.3.005. 0/4 Submissions](https://s3.amazonaws.com/si.experts.images/answers/2024/06/6660eeb273734_5946660eeb25d6e7.jpg)

![under the graph of fon the interval [0, 4]. 8 8 8](https://s3.amazonaws.com/si.experts.images/answers/2024/06/6660eeb301c65_5946660eeb2e3bde.jpg)
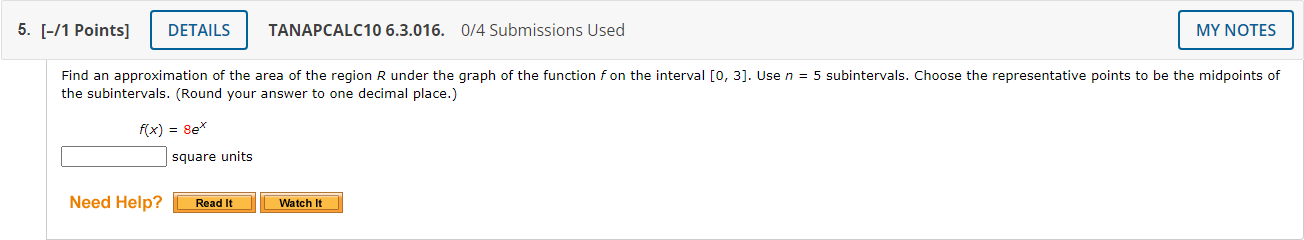
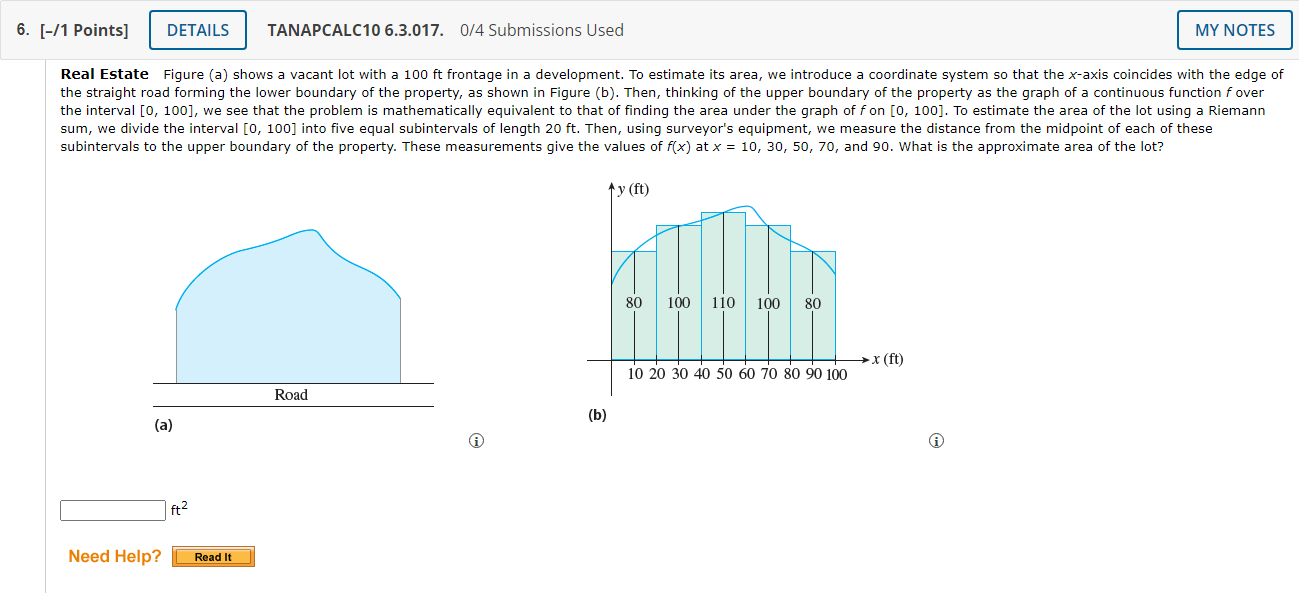

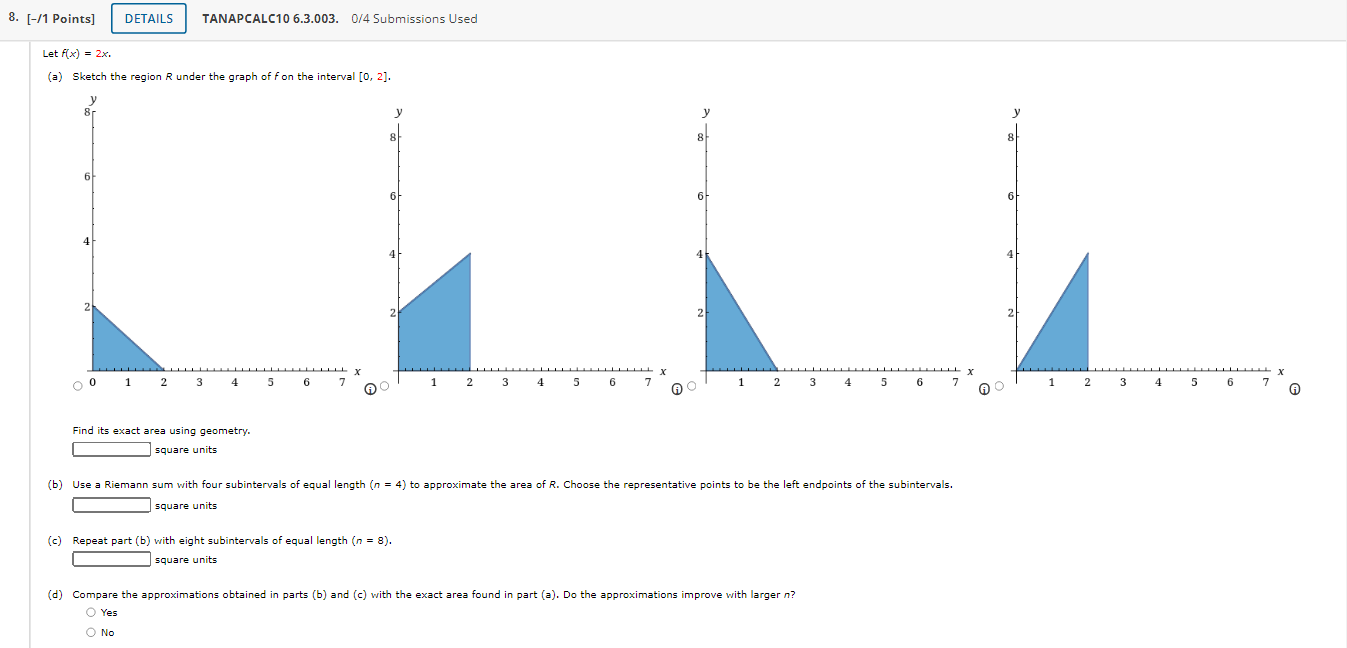

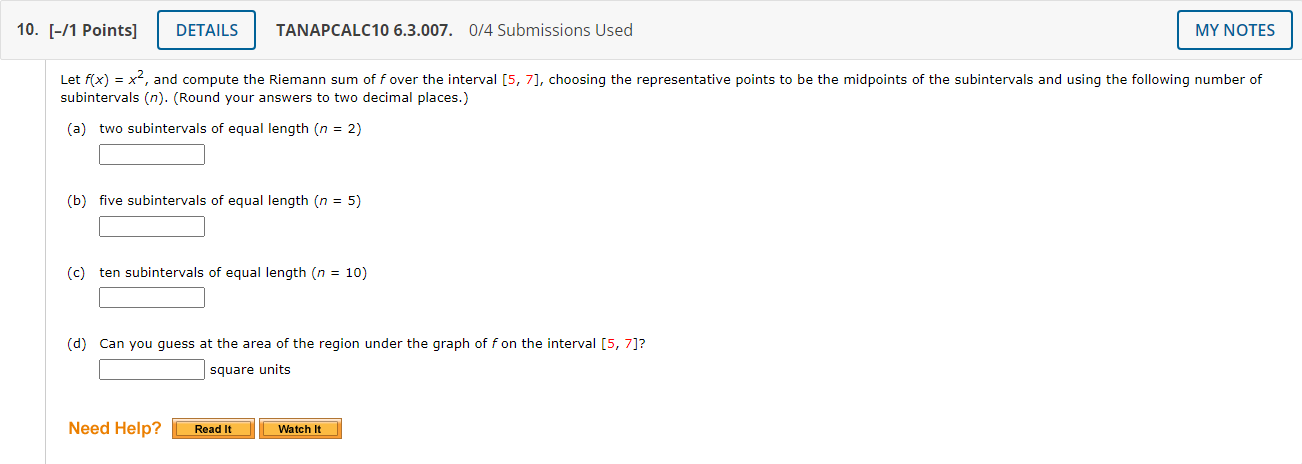
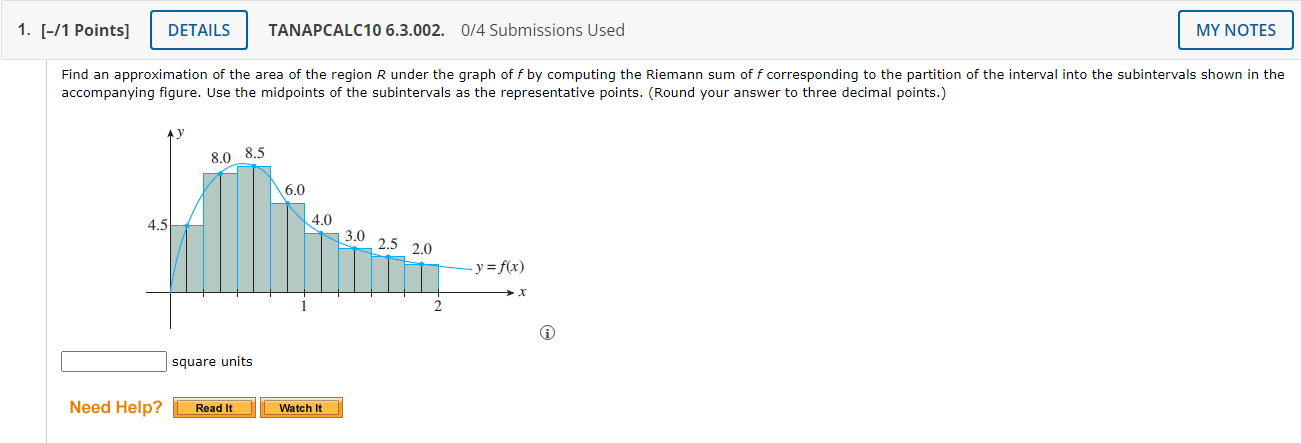
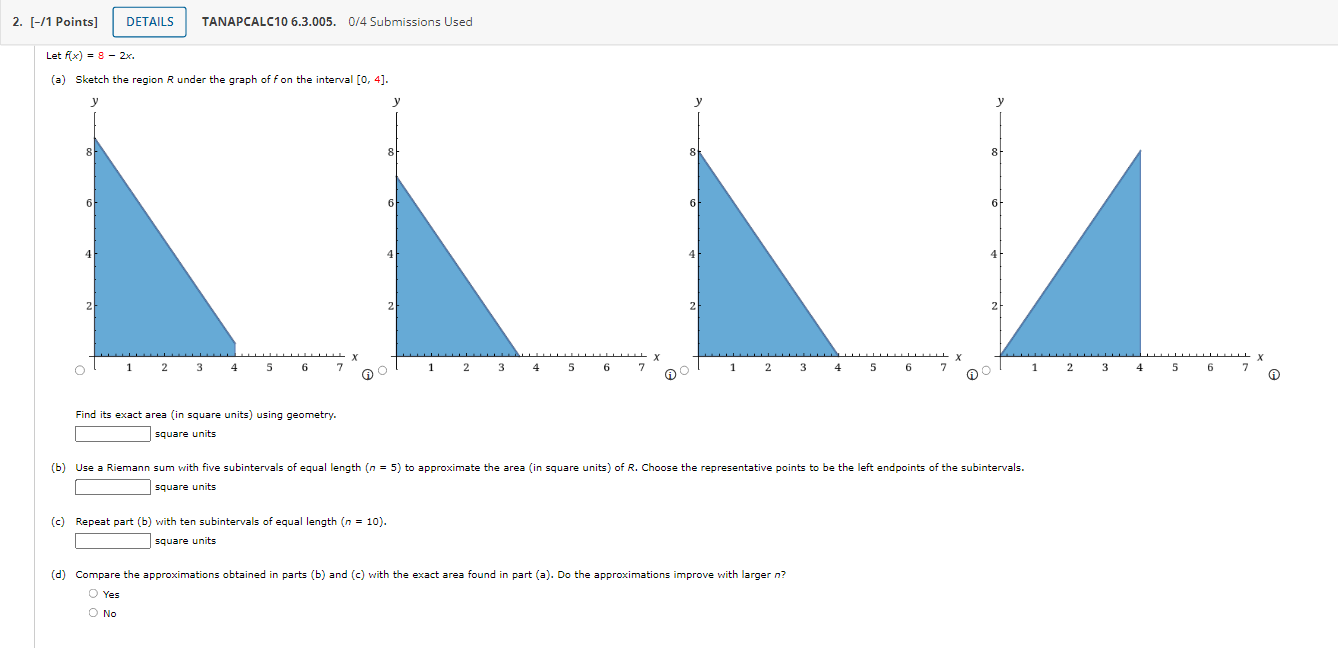
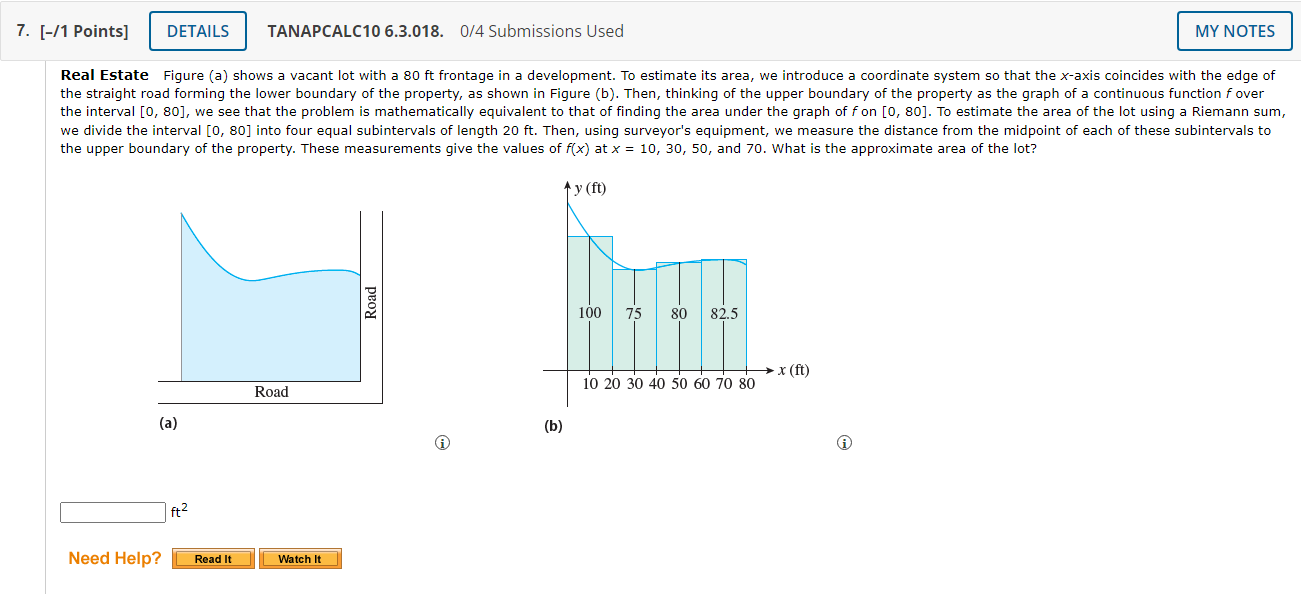
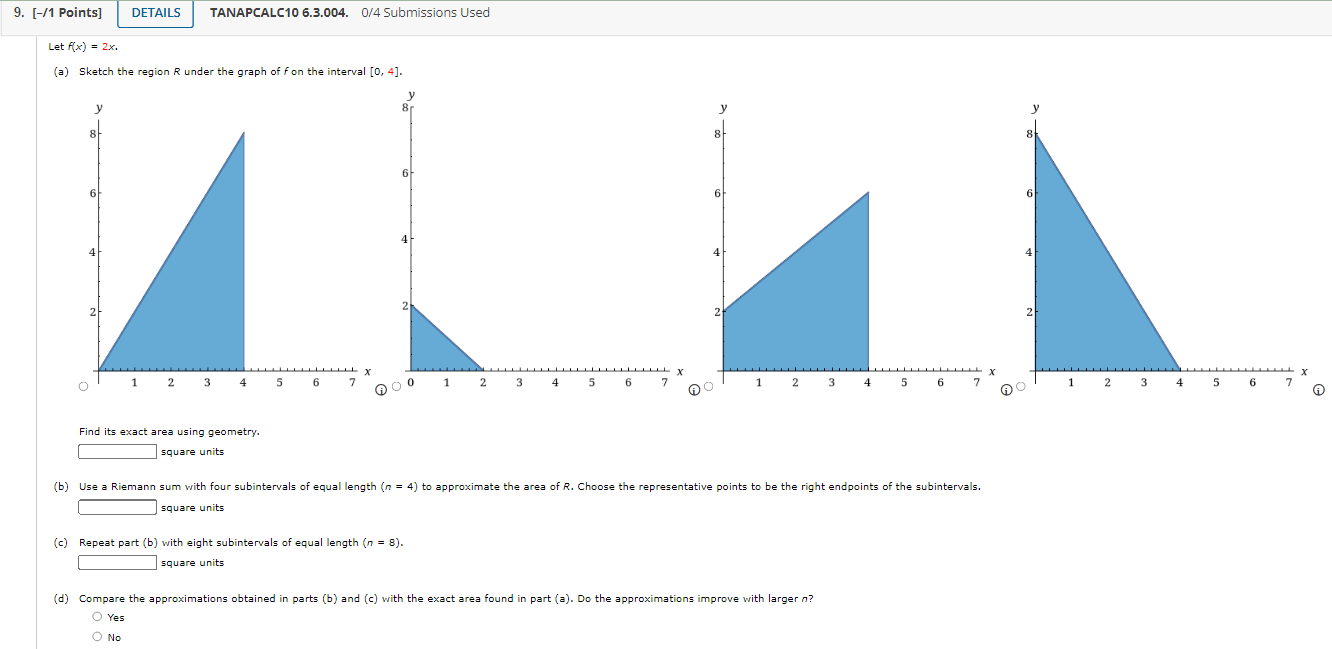
1. [-/1 Points] DETAILS TANAPCALC10 6.3.002. 0/4 Submissions Used MY NOTES Find an approximation of the area of the region R under the graph of f by computing the Riemann sum of f corresponding to the partition of the interval into the subintervals shown in the accompanying figure. Use the midpoints of the subintervals as the representative points. (Round your answer to three decimal points.) 8.0 8.5 6.0 4.5 4.0 3.0 2.5 2.0 y = f(x) X square units Need Help? Read It Watch It2. [-/1 Points] DETAILS TANAPCALC10 6.3.005. 0/4 Submissions Used Let Ax) = 8 - 2x. (a) Sketch the region R under the graph of fon the interval [0, 4]. 8 8 8 6 4 2 2 2 2 X X TIT L X 2 3 4 6 AO 2 3 5 6 AO 2 3 4 5 6 7 2 3 4 5 6 7 A Find its exact area (in square units) using geometry. square units (b) Use a Riemann sum with five subintervals of equal length (n = 5) to approximate the area (in square units) of R. Choose the representative points to be the left endpoints of the subintervals. square units (c) Repeat part (b) with ten subintervals of equal length (n = 10). square units (d) Compare the approximations obtained in parts (b) and (c) with the exact area found in part (a). Do the approximations improve with larger n? O Yes O No3. [-/1 Points] DETAILS TANAPCALC10 6.3.013.MI. 0/4 Submissions Used MY NOTES Find an approximation of the area of the region R under the graph of the function fon the interval [0, 2]. Use n = 5 subintervals. Choose the representative points to be the midpoints of the subintervals. f ( x ) = x- + 8 square units Need Help? Read It Master It 4. [-/1 Points] DETAILS TANAPCALC10 6.3.014. 0/4 Submissions Used MY NOTES Find an approximation of the area of the region R under the graph of the function fon the interval [-1, 2]. Use n = 6 subintervals. Choose the representative points to be the left endpoints of the subintervals. f(x) = 10 - x2 square units Need Help? Read It Watch It5. [-/1 Points] DETAILS TANAPCALC10 6.3.016. 0/4 Submissions Used MY NOTES Find an approximation of the area of the region R under the graph of the function fon the interval [0, 3]. Use n = 5 subintervals. Choose the representative points to be the midpoints of the subintervals. (Round your answer to one decimal place.) f(x) = 8ex square units Need Help? Read It Watch ItTANAPCALC10 6.3.017. UM Submissions Used 6. [-f1 Points] Real Estate Figure (a) shows a vacant lot with a 100 ft frontage in a development. To estimate its area, we introduce a coordinate system so that the x-axis coincides with the edge of the straight road forming the lower boundary of the property, as shown in Figure (h). Then, thinking of the upper boundary of the property as the graph of a continuous function foyer the interval [0, 100], we see that the problem is mathematically equivalent to that of nding the area under the graph of f on [0, 100]. To estimate the area ofthe lot using a Riemann sum, we divide the interval [0, 100] into five equal subintervals of length 20 ft. Then, using surveyor's equipment, we measure the distance from the midpoint of each of these subintervals to the upper boundary of the property. These measurements give the values of x) at x = 10, 30, 50, 70, and 90. What is the approximate area ofthe lot? x () 102030405060708090100 Road (a) (in) Need Help? 7. [-11 Points] TANAPCALC106.3.013. 0f4Sul)missions Used Real Estate Figure (a) shows a vacant lot with a 80 ft frontage in a development. To estimate its area, we introduce a coordinate system so that the xaxis coincides with the edge of the straight road forming the lower boundary of the property, as shown in Figure (in). Then, thinking of the upper boundary of the propertyr as the graph of a continuous function fover the interval [0, 80], we see that the problem is mathematically equivalent to that of nding the area under the graph offon [0, 80]. To estimate the area of the lot using a Riemann sum, we divide the interval [0, SD] into four equal subintervals of length 20 ft. Then, using surveyor's equipment, we measure the distance from the midpoint of each of these subintervals to the upper boundary of the property. These measurements give the values of x) at x = 10, 30, SD, and 3'0. What is the approximate area of the lot? ' J? (ft) '\ or: 1: T' g or: 100 75 80 82.5 . . . i i )- rm) Road 10 20 304-05060?0 80 (a) (b) 6) G) Need Help? 8. [-/1 Points] DETAILS TANAPCALC10 6.3.003. 0/4 Submissions Used Let A(x) = 2x. (a) Sketch the region R under the graph of f on the interval [0, 2]. 6 6 6 4 4 4 4 2 2 2 0 0 1 2 4 5 6 AC 5 6 7 AO 2 6 7 AO 2 3 " X 4 5 6 7 Find its exact area using geometry. A square units (b) Use a Riemann sum with four subintervals of equal length (n = 4) to approximate the area of R. Choose the representative points to be the left endpoints of the subintervals. square units (c) Repeat part (b) with eight subintervals of equal length (n = 8). square units O Yes (d) Compare the approximations obtained in parts (b) and (c) with the exact area found in part (a). Do the approximations improve with larger n? O No9. [-/1 Points] DETAILS TANAPCALC10 6.3.004. 0/4 Submissions Used Let A(x) = 2x. (a) Sketch the region R under the graph of fon the interval [0, 4]. 6 6 6 4 4 4 2 2 2 2 2 3 4 5 6 60 0 1 2 3 5 6 7 2 3 X 5 6 1 2 3 4 X 5 Find its exact area using geometry. 6 7 square units square units (b) Use a Riemann sum with four subintervals of equal length (n = 4) to approximate the area of R. Choose the representative points to be the right endpoints of the subintervals. (c) Repeat part (b) with eight subintervals of equal length (n = 8). square units O Yes (d) Compare the approximations obtained in parts (b) and (c) with the exact area found in part (a). Do the approximations improve with larger n? O No10. [-/1 Points] DETAILS TANAPCALC10 6.3.007. 0/4 Submissions Used MY NOTES Let f(x) = x", and compute the Riemann sum of f over the interval [5, 7], choosing the representative points to be the midpoints of the subintervals and using the following number of subintervals (n). (Round your answers to two decimal places.) (a) two subintervals of equal length (n = 2) (b) five subintervals of equal length (n = 5) (c) ten subintervals of equal length (n = 10) (d) Can you guess at the area of the region under the graph of fon the interval [5, 7]? square units Need Help? Read It Watch It
Step by Step Solution
There are 3 Steps involved in it

Get step-by-step solutions from verified subject matter experts