

Question: Find Ratio : (A) Current Ratio (B) Debt to EBITDA (C) Cash Flow (D) Free Cash Flow (E) EPS 1. Did the firm issue or
Find Ratio : (A) Current Ratio (B) Debt to EBITDA (C) Cash Flow (D) Free Cash Flow (E) EPS
1. Did the firm issue or buy back stock?
2. Did the firm issue or buy back debt?
2. Can firm cover it's dividend with FCF?
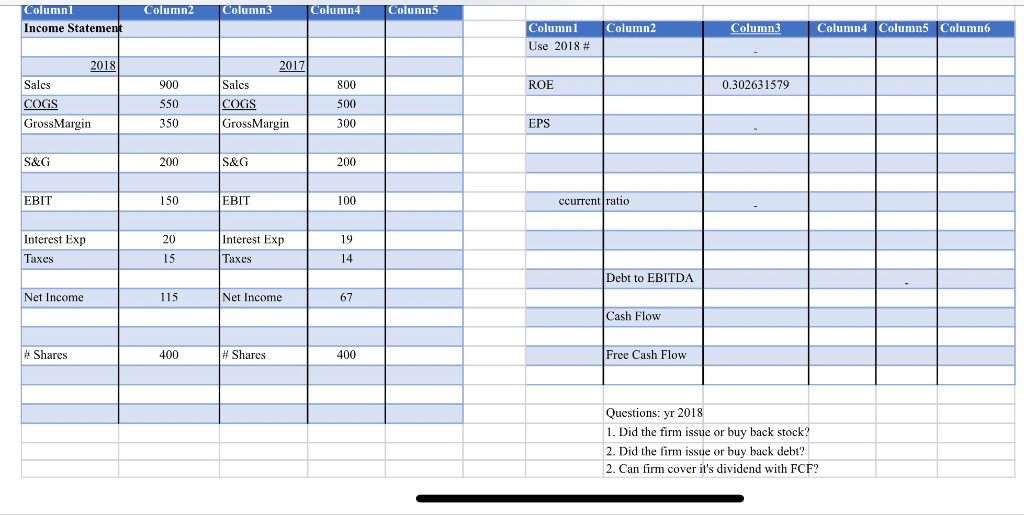
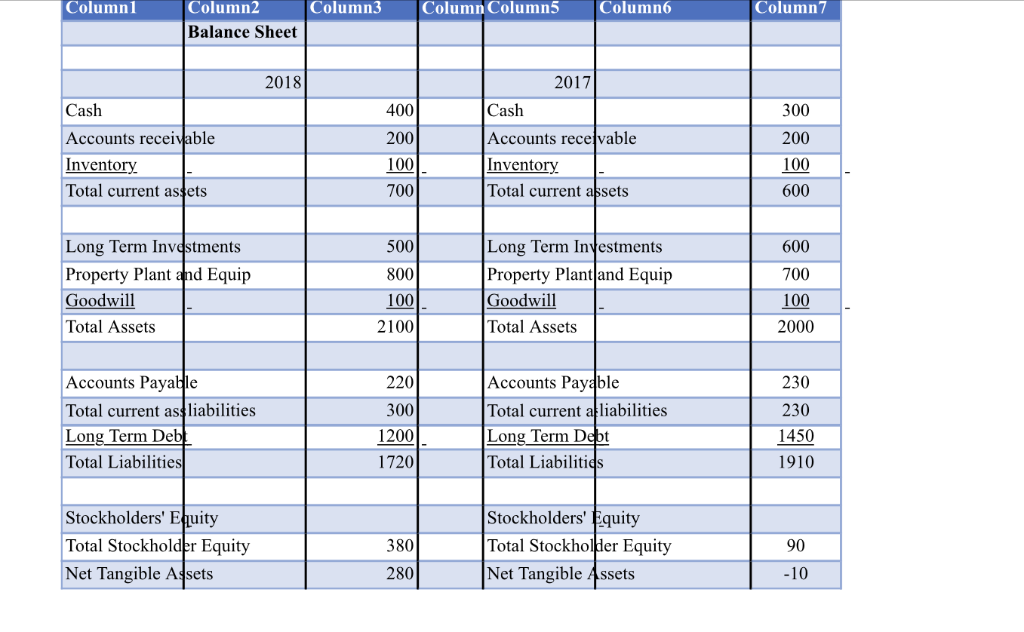
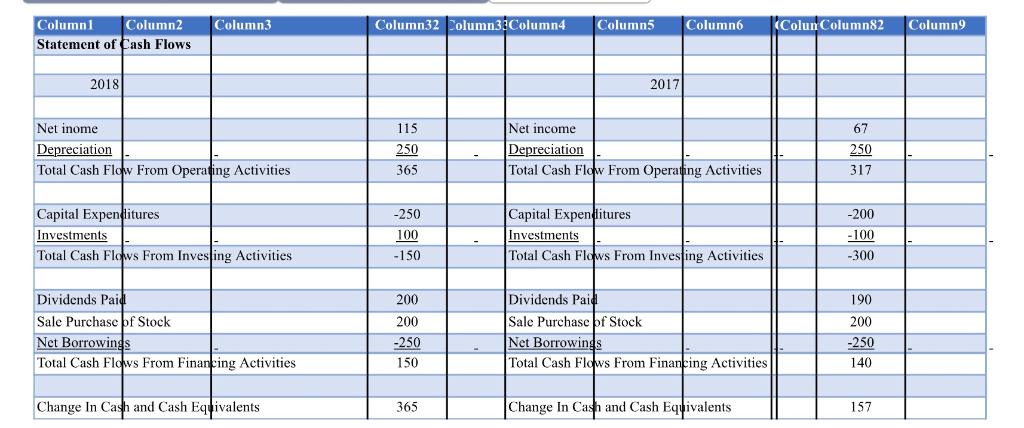
Columnl Column2 Column3 Column4 Column5 Income Stateme Column3 Column4 Column5 Column6 Columnl Use 2018 # Column2 2018 2017 Salcs COGS GrossMargin 900 550 350 Salcs COGS GrossMargin 800 500 300 ROE 0.302631579 EPS S&G 200 S&G 200 EBIT 150 EBIT 100 ccurrent ratio Interest Exp 20 Interest Exp 19 laxes Taxes 14 Debt to EBITDA Net Income 115 Net Income 67 Cash Flow # Shares 400 # Shares 400 Free Cash Flow Questions: yr 2018 1. Did the firm issue or buy back stock? 2. Did the 2. Can firm cover it's dividend with FCF? firm issue or buy back debt? Columnl Column2 Column23 Column Column5 Column6 Column7 Balance Sheet 2018 2017 Cash Accounts receivable Inventory Total current assets 400 200 100 700 Cash Accounts recejvable Inventory Total current assets 300 200 100 600 Long Term Invdstments Property Plant and Equip Goodwil Total Assets 500 800 100 2100 600 700 100 2000 Long Term Investments Property Plantand Equip oodwil Total Assets 220 Accounts Payable Total current assliabilities Long Term De Total Liabilities Accounts Payable Total current al liabilities Long Term Debt Total Liabilitics 230 230 1450 1910 300 1720 Stockholders' Equity Total Stockholder Equity Net Tangible Assets 380 280 Stockholders' Equity Total Stockholder Equity Net Tangible Assets 90 -10 Column1 Statement of Cash FlowS Column32 Column3Column4 Column2 Column3 Column:5 Column6 (Colun Column82 Column9 2018 2017 115 250 365 67 250 317 Net inome Net income Depreciation Total Cash Flow From Operating Activities eprec Total Cash Flow From Operating Activities Capital ExpenHitures Capital Expenditures Investments Total Cash Flows From Investing Activities -250 100 150 -200 100 -300 Investments Total Cash Flows From Investing Activities 200 200 -250 150 190 200 Dividends Pai Sale Purchase of Stock Net Borrowings Total Cash Flows From Financing Activities Dividends Pai Sale Purchase of Stock Net Borrowings Total Cash Flows From Financing Activities 140 Change In Cash and Cash Eqivalents 365 Change In Cash and Cash Eqivalents 157 Columnl Column2 Column3 Column4 Column5 Income Stateme Column3 Column4 Column5 Column6 Columnl Use 2018 # Column2 2018 2017 Salcs COGS GrossMargin 900 550 350 Salcs COGS GrossMargin 800 500 300 ROE 0.302631579 EPS S&G 200 S&G 200 EBIT 150 EBIT 100 ccurrent ratio Interest Exp 20 Interest Exp 19 laxes Taxes 14 Debt to EBITDA Net Income 115 Net Income 67 Cash Flow # Shares 400 # Shares 400 Free Cash Flow Questions: yr 2018 1. Did the firm issue or buy back stock? 2. Did the 2. Can firm cover it's dividend with FCF? firm issue or buy back debt? Columnl Column2 Column23 Column Column5 Column6 Column7 Balance Sheet 2018 2017 Cash Accounts receivable Inventory Total current assets 400 200 100 700 Cash Accounts recejvable Inventory Total current assets 300 200 100 600 Long Term Invdstments Property Plant and Equip Goodwil Total Assets 500 800 100 2100 600 700 100 2000 Long Term Investments Property Plantand Equip oodwil Total Assets 220 Accounts Payable Total current assliabilities Long Term De Total Liabilities Accounts Payable Total current al liabilities Long Term Debt Total Liabilitics 230 230 1450 1910 300 1720 Stockholders' Equity Total Stockholder Equity Net Tangible Assets 380 280 Stockholders' Equity Total Stockholder Equity Net Tangible Assets 90 -10 Column1 Statement of Cash FlowS Column32 Column3Column4 Column2 Column3 Column:5 Column6 (Colun Column82 Column9 2018 2017 115 250 365 67 250 317 Net inome Net income Depreciation Total Cash Flow From Operating Activities eprec Total Cash Flow From Operating Activities Capital ExpenHitures Capital Expenditures Investments Total Cash Flows From Investing Activities -250 100 150 -200 100 -300 Investments Total Cash Flows From Investing Activities 200 200 -250 150 190 200 Dividends Pai Sale Purchase of Stock Net Borrowings Total Cash Flows From Financing Activities Dividends Pai Sale Purchase of Stock Net Borrowings Total Cash Flows From Financing Activities 140 Change In Cash and Cash Eqivalents 365 Change In Cash and Cash Eqivalents 157
Step by Step Solution
There are 3 Steps involved in it

Get step-by-step solutions from verified subject matter experts