

Question: Find solutions for your homework Search home / study / business / finance / finance questions and answers / for the three banks that had
Find solutions for your homework
Search
home / study / business / finance / finance questions and answers / for the three banks that had the biggest increase in the htm percentage from 2013 to 2018, ...
Question: For the three banks that had the biggest increase in the HTM percentage from 2013 to 2018, name t...
For the three banks that had the biggest increase in the HTM percentage from 2013 to 2018, name these banks and describe how increases or decreases in HTM and AFS investments held contributed to the shift. Which large banks (if any) shifted their investment portfolios away from HTM investments during that time period?
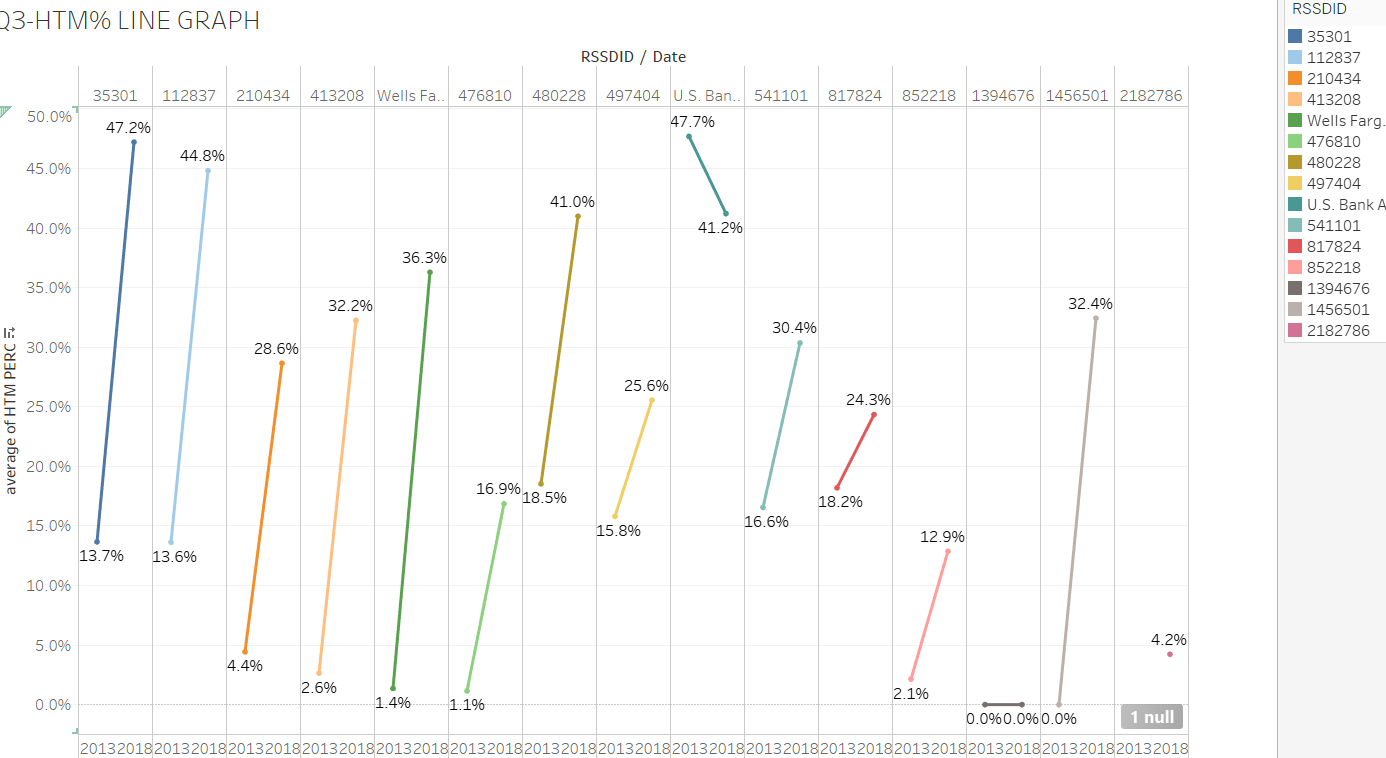
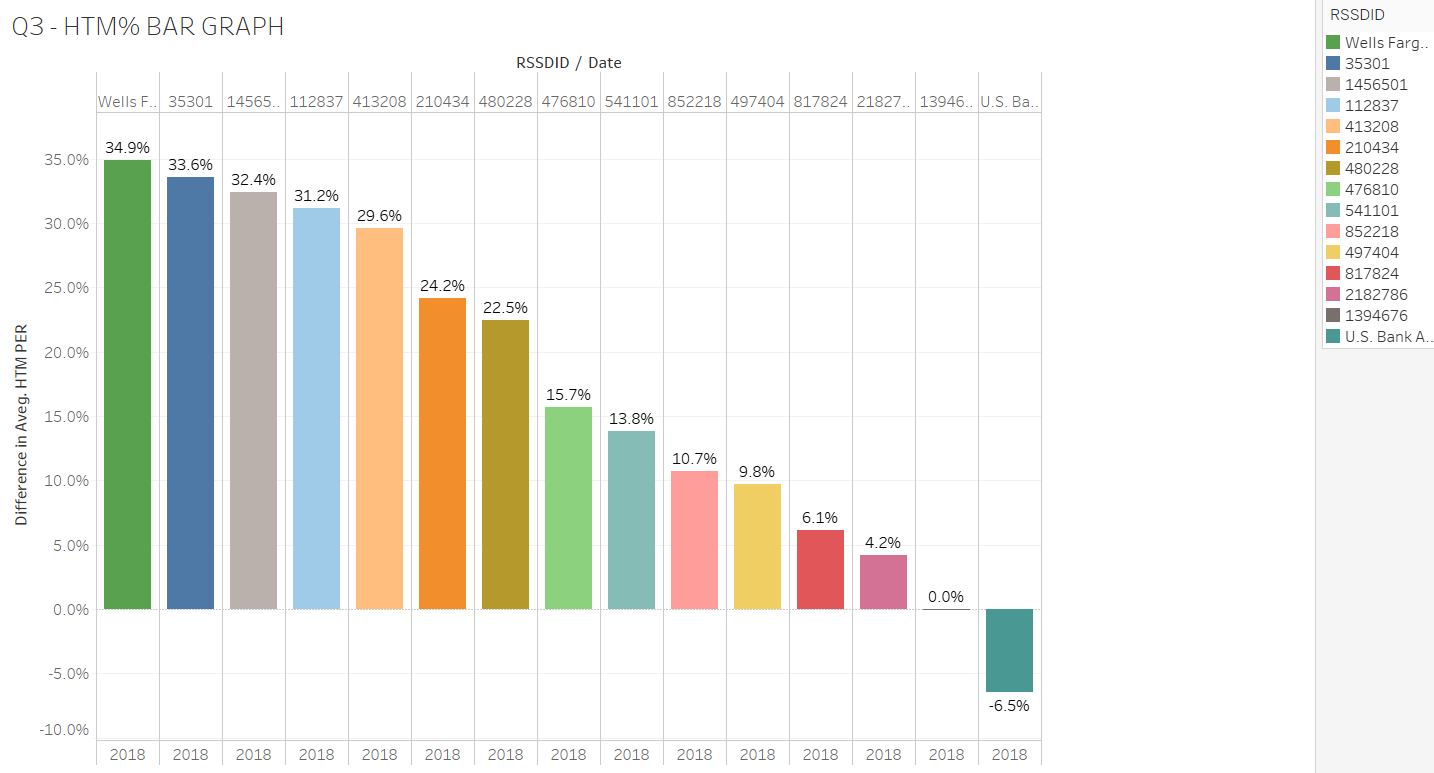
RSSDID 23-HTM% LINE GRAPH RSSDID / Date 35301 112837 210434 413208 Wells Fa. 476810 480228 541101 817824 852218 1394676 1456501 2182786 50.096 497404 US, Ban, 47.7% 47.296 44.896 45.0% TI 35301 112837 210434 413208 Wells Farg 476810 480228 497404 U.S. Bank A 541101 817824 852218 | 1394676 1456501 2182786 41.096 40.0% 41.2% 36.396 35.0% 32.296 32.4% 30.49 30.0% 28.696 25.6% 25.0% 24.3% average of HTM PERC == 20.0% 16.9% 18.5% 18.2% 15.09 16.69 15.8% 12.99 13.796 13.6% 10.0% 5.0% 4.296 4.496 2.6% 0.096 1.49 2.196 1.1% 0.0%0.0% 0.0% 1 null 201320182013201820132018201320182013201820132018201320182013201820132018201320182013201820132018201320182013201820132018 Q3- HTM% BAR GRAPH RSSDID / Date Wells F.. 35301 14565.. 112837 413208 210434 480228 476810 541101 852218 497404 817824 21827. 13946. U.S. Ba.. 34.9% 35.0% 33.69 32.4% RSSDID Wells Farg. 35301 1456501 112837 413208 210434 480228 476810 541101 852218 497404 817824 2182786 1394676 U.S. Bank A. 31.29% 29.69 30.0% 25.0% 24.2% 22.59 20.0% 15.7% 15.0% Difference in Aveg. HTM PER 13.8% 10.7% 9.8% 10.0% 6.1% 5.0% 4.2% 0.0% 0.0% -5.0% -6.5% -10.0% 2018 2018 2018 2018 2018 2018 2018 2018 2018 2018 2018 2018 2018 2018 2018 RSSDID 23-HTM% LINE GRAPH RSSDID / Date 35301 112837 210434 413208 Wells Fa. 476810 480228 541101 817824 852218 1394676 1456501 2182786 50.096 497404 US, Ban, 47.7% 47.296 44.896 45.0% TI 35301 112837 210434 413208 Wells Farg 476810 480228 497404 U.S. Bank A 541101 817824 852218 | 1394676 1456501 2182786 41.096 40.0% 41.2% 36.396 35.0% 32.296 32.4% 30.49 30.0% 28.696 25.6% 25.0% 24.3% average of HTM PERC == 20.0% 16.9% 18.5% 18.2% 15.09 16.69 15.8% 12.99 13.796 13.6% 10.0% 5.0% 4.296 4.496 2.6% 0.096 1.49 2.196 1.1% 0.0%0.0% 0.0% 1 null 201320182013201820132018201320182013201820132018201320182013201820132018201320182013201820132018201320182013201820132018 Q3- HTM% BAR GRAPH RSSDID / Date Wells F.. 35301 14565.. 112837 413208 210434 480228 476810 541101 852218 497404 817824 21827. 13946. U.S. Ba.. 34.9% 35.0% 33.69 32.4% RSSDID Wells Farg. 35301 1456501 112837 413208 210434 480228 476810 541101 852218 497404 817824 2182786 1394676 U.S. Bank A. 31.29% 29.69 30.0% 25.0% 24.2% 22.59 20.0% 15.7% 15.0% Difference in Aveg. HTM PER 13.8% 10.7% 9.8% 10.0% 6.1% 5.0% 4.2% 0.0% 0.0% -5.0% -6.5% -10.0% 2018 2018 2018 2018 2018 2018 2018 2018 2018 2018 2018 2018 2018 2018 2018
Step by Step Solution
There are 3 Steps involved in it

Get step-by-step solutions from verified subject matter experts