

Question: Find the accumulation function F. Then evaluate F at each value of the independent variable and graphically show the area given by each value
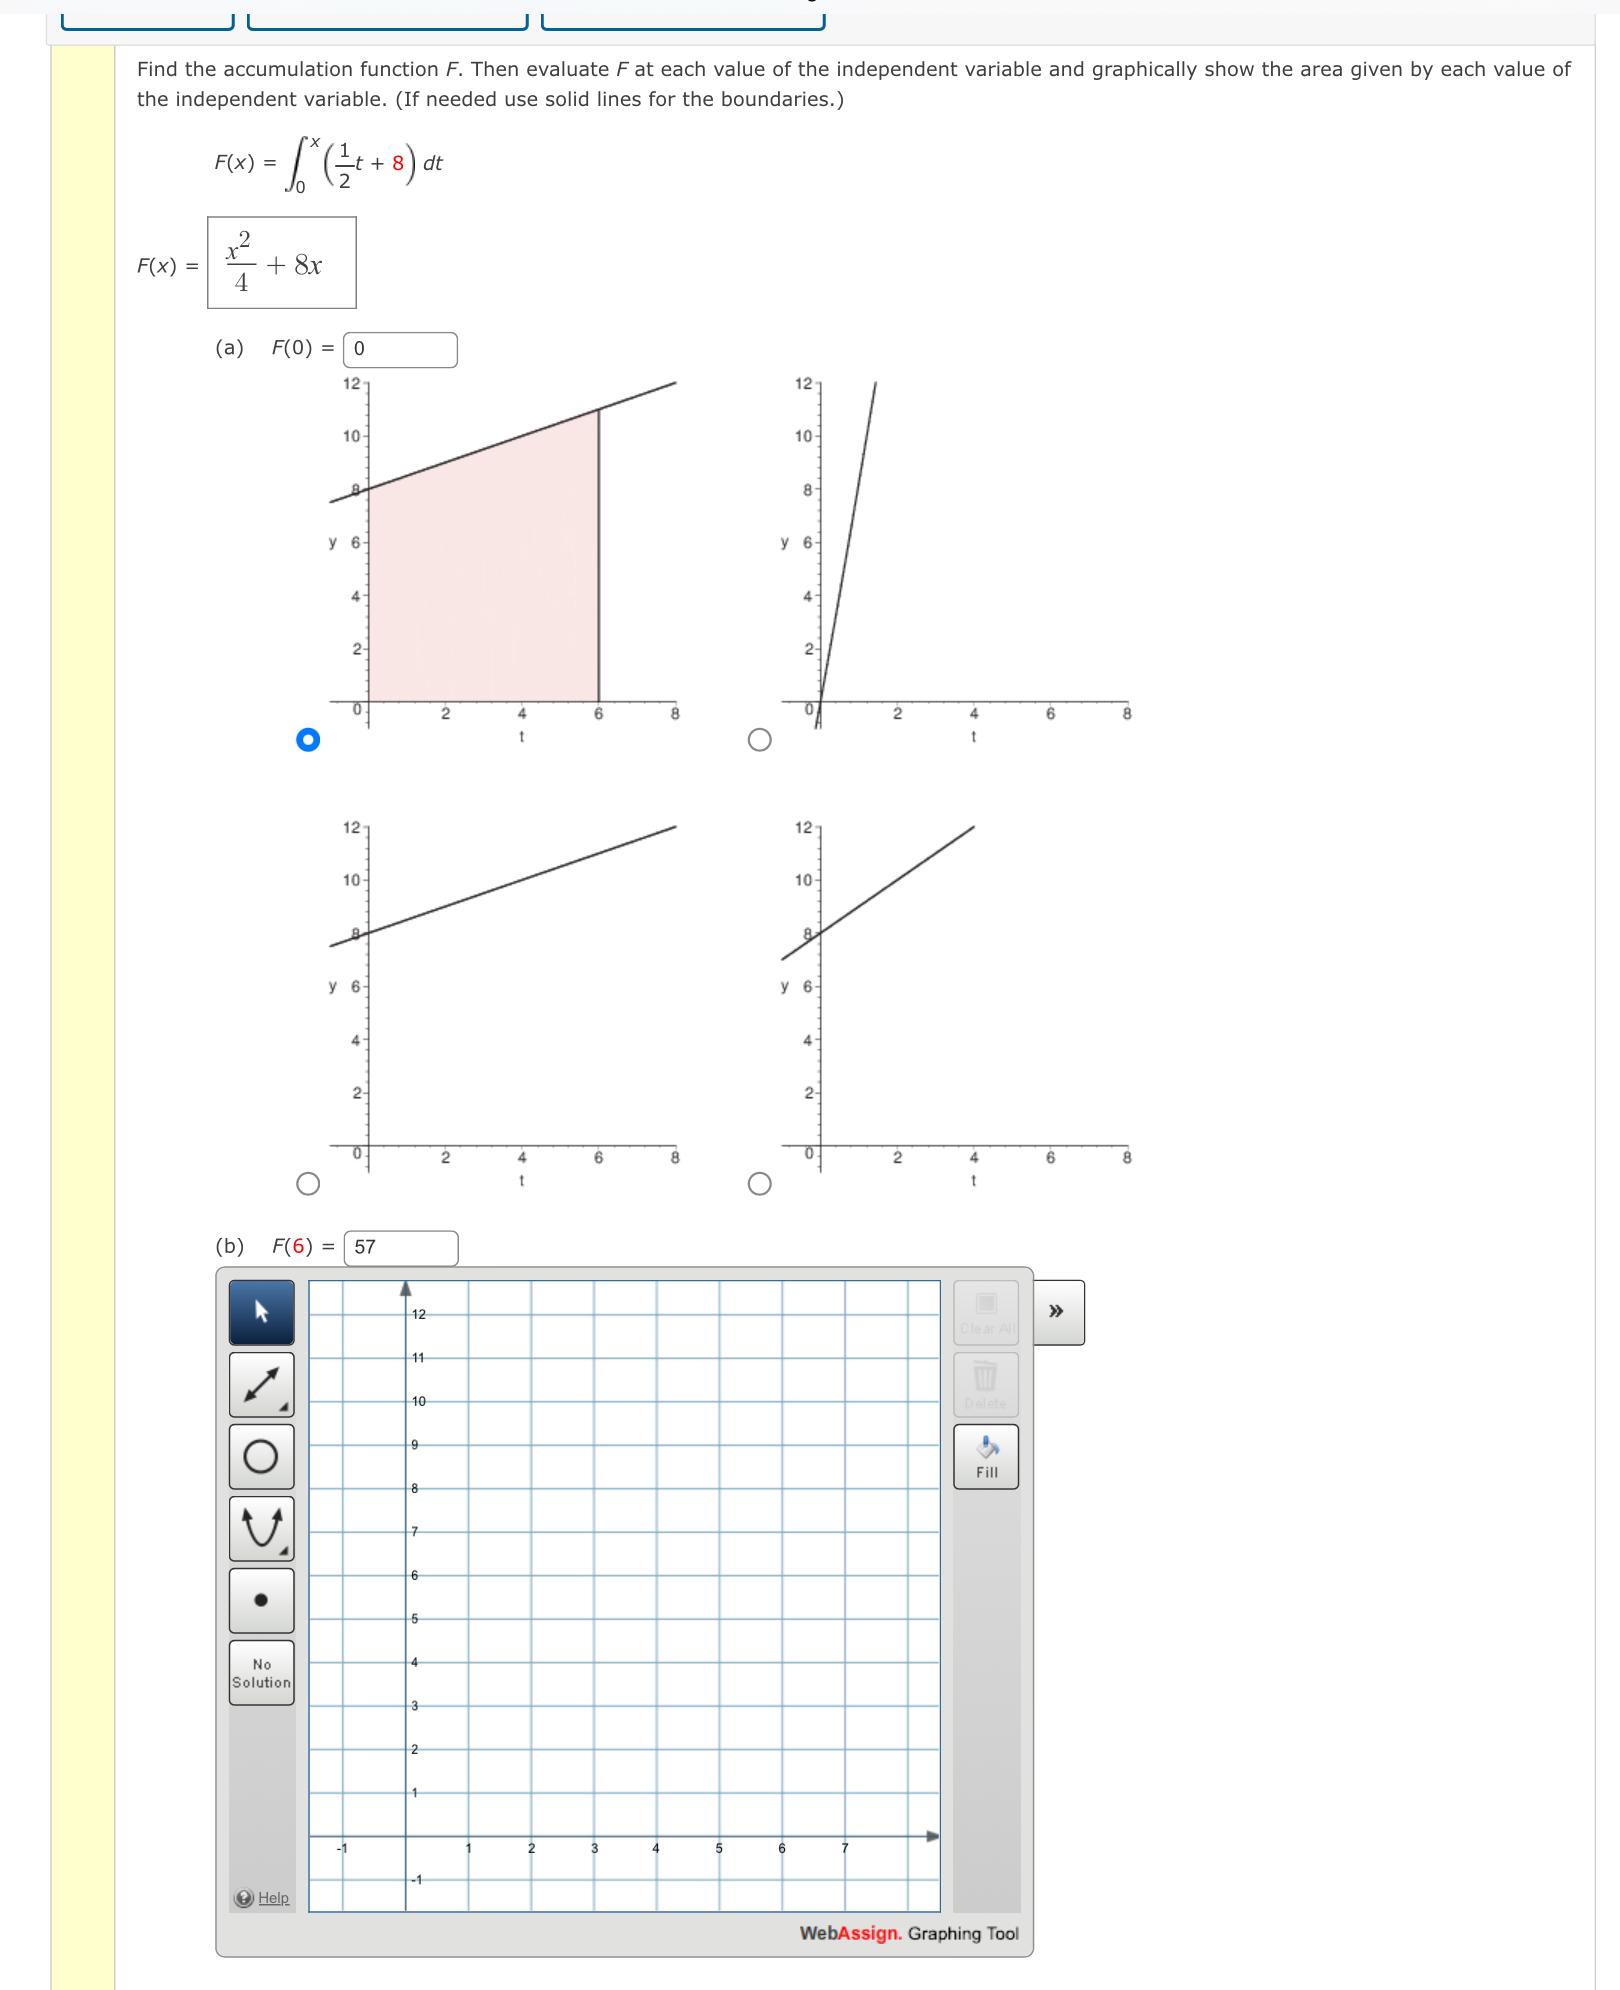
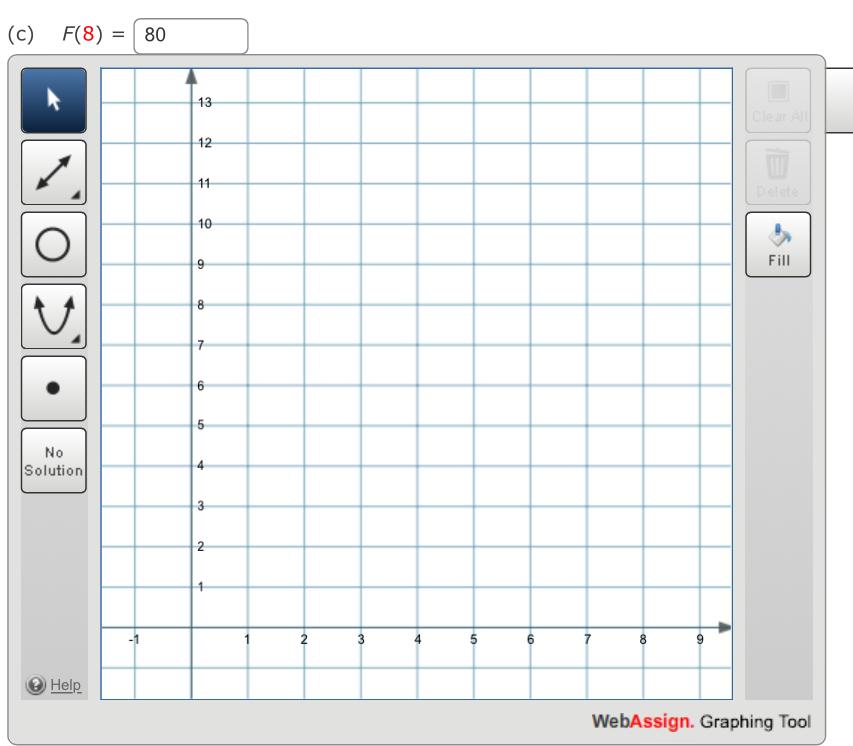
Find the accumulation function F. Then evaluate F at each value of the independent variable and graphically show the area given by each value of the independent variable. (If needed use solid lines for the boundaries.) F(x) = t - L* (+ + 8) dt *(+ F(x) = +8x 4 (a) F(0) = 0 12 12 10- 10- y 6 4- 2- 12- 10- y 6- 4- 2- (b) F(6) = 57 O 12 11 10 9 8 7 6 5 No 4 Solution 3 Help -1 2 2 6 2 4 6 t 8- y 6- 12 4 2- 10- 8 y 6 41 2- 2 5 6 7 -1 2 4 6 2 4 6 8 t Clear All Delete Fill WebAssign. Graphing Tool (c) F(8) = 80 5 13 12 Clear All No Solution 11 6 10 Delete Fill 8 6 Help 3 2 2 10 4 6 7 8 WebAssign. Graphing Tool
Step by Step Solution
There are 3 Steps involved in it
Graph Explanation Graph at F0 No area is shaded ... View full answer

Get step-by-step solutions from verified subject matter experts