

Question: Find the answer Data were collected on the total energy consumption per capita (in million BTUs) for some states.Asummary of the data is shown in
Find the answer
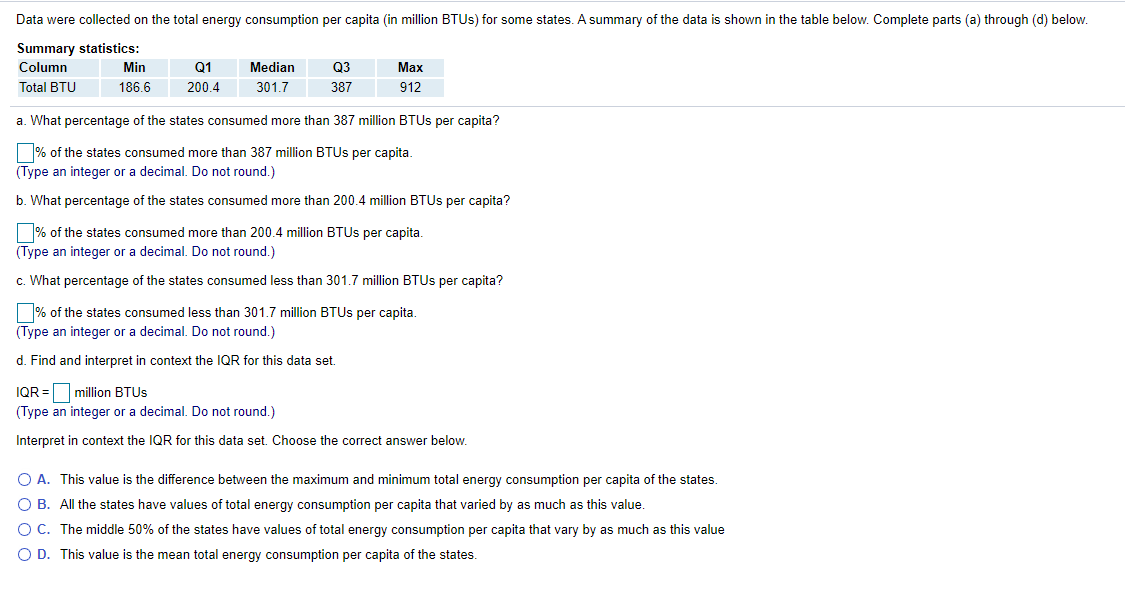
Data were collected on the total energy consumption per capita (in million BTUs) for some states.Asummary of the data is shown in the table below. Complete parts (a) through (d) below. Summary statistics: Column Min Q1 Median Q3 Max Total BTU 136.6 200.4 301.7 38? 912 a. What percentage of the states consumed more than 337 million BTUs per capita? "it; of the states consumed more than 337 million BTUs per capita. (Type an integer or a decimal. Do not round.) b. What percentage of the states consumed more than 200.4 million BTUs per capita? "it; of the states consumed more than 200.4 million BTUs per capita. (Type an integer or a decimal. Do not round.) c. What percentage of the states consumed less than 301.? million BTUs per capita? "it; of the states consumed less than 301.7Ir million BTUs per capita. (Type an integer or a decimal. Do not round.) d. Find and interpret in context the IQR for this data set. IQR = million BTUs (Type an integer or a decimal. Do not round.) Interpret in context the IQR for this data set. Choose the correct answer below. 0 A. This value is the diiterence between the maximum and minimum total energy consumption per capita of the states. 0 B. All the states have values of total energy consumption per capita that varied by as much as this value. 0 C. The middle 50% of the states have values of total energy consumption per capita that vary by as much as this value 0 D. This value is the mean total energy consumption per capita of the states
Step by Step Solution
There are 3 Steps involved in it

Get step-by-step solutions from verified subject matter experts