Question: find the average value Hint(s) Check My Work The following list gives the number of defects found in 30 samples of 100 electronic assemblies taken

find the average value find the average value Hint(s) Check My Work The
Hint(s) Check My Work The following list gives the number of defects found in 30 samples of 100 electronic assemblies taken on a daily basis over one month plot the data on run chart, computing the average value (center line). How do you interpret the chart? Samples 1-10 Samples 11-20 Samples 21:50 Find the average value. Round your answer to one decimal place 13 15 20 25 3 1 2 2677 14 31 36 62 4464 3 Choose the correct graph for the data provided The correct graph is graph

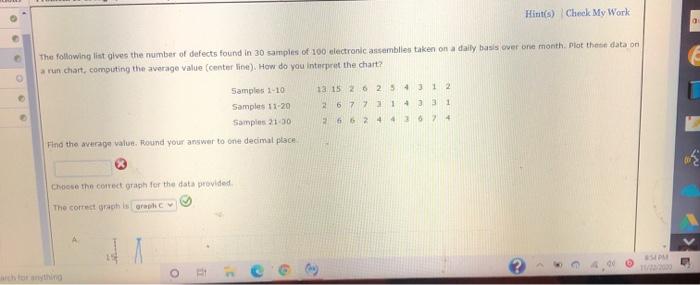
Step by Step Solution

There are 3 Steps involved in it

1 Expert Approved Answer
Step: 1 Unlock blur-text-image
Question Has Been Solved by an Expert!

Get step-by-step solutions from verified subject matter experts

Step: 2 Unlock
Step: 3 Unlock

Students Have Also Explored These Related General Management Questions!