

Question: Find the break-even point using the data below. Please plot and show all steps Please also mention the fixed costs, variable costs, etc. TC =
Find the break-even point using the data below.
Please plot and show all steps
Please also mention the fixed costs, variable costs, etc.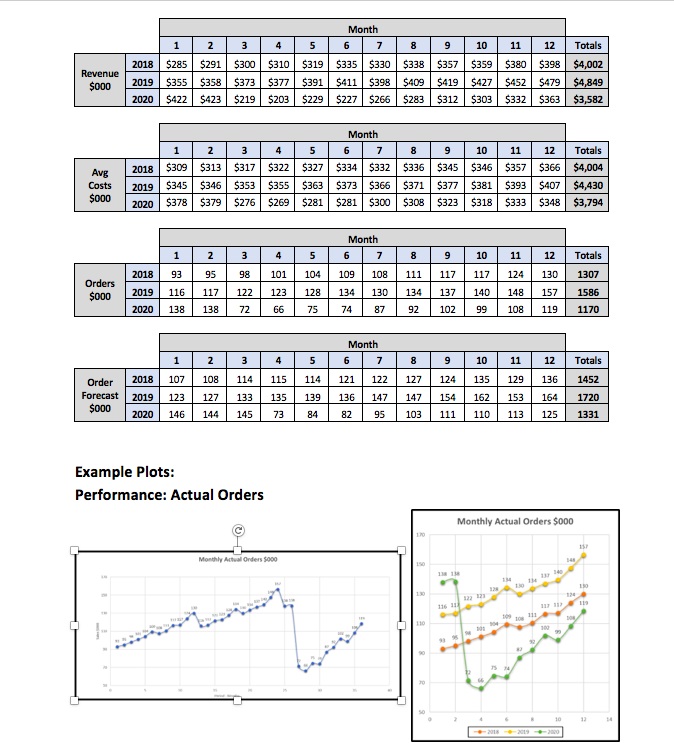
TC = FC + VC = FC + Q X v
TR = Q X r
Month 6 7 1 2 3 4 5 9 10 11 12 Totals Revenue $000 2018 $285 $291 $300 $310 $319 $335 $330 $338 2019 $355 $358 $373 $377 $391 $411 $398 $409 2020 $422 $423 $219 $203 $229 $227 $266 $283 $357 $359 $380 $398 $4,002 $419 $427 $452 $479 $4,849 $312 $303 $332 $363 $3,582 N 9 12 Totals 2018 Month 1 3 4 5 6 7 8 $309 $313 $317 $322 $327 $334 $332 $336 $345 $346 $353 $355 $363 $373 $366 $371 $378 $379 $276 $269 $281 $281 $300 $308 $345 Avg Costs $000 10 11 $346 $357 $381 $393 $318 $333 2019 2020 $377 $323 $366 $4,004 $407 $4,430 $348 $3,794 Month 6 7 1 2 3 4 5 8 9 10 11 12 93 95 98 101 104 108 111 124 130 Orders $000 2018 2019 109 134 117 140 Totals 1307 1586 1170 116 117 123 128 130 117 137 102 134 122 72 148 157 119 2020 138 138 66 75 74 87 92 99 108 Month 6 7 1 2 3 4 5 8 9 10 11 12 Totals 2018 107 108 114 115 114 121 122 127 124 135 129 136 1452 Order Forecast $000 127 135 139 136 147 147 154 162 153 2019 2020 123 146 133 145 164 125 1720 1331 144 73 84 82 95 103 111 110 113 Example Plots: Performance: Actual Orders Monthly Actual Orders $000 157 Monthly Attual Orders 000 10 136 111 10 10 12 2012 Month 6 7 1 2 3 4 5 9 10 11 12 Totals Revenue $000 2018 $285 $291 $300 $310 $319 $335 $330 $338 2019 $355 $358 $373 $377 $391 $411 $398 $409 2020 $422 $423 $219 $203 $229 $227 $266 $283 $357 $359 $380 $398 $4,002 $419 $427 $452 $479 $4,849 $312 $303 $332 $363 $3,582 N 9 12 Totals 2018 Month 1 3 4 5 6 7 8 $309 $313 $317 $322 $327 $334 $332 $336 $345 $346 $353 $355 $363 $373 $366 $371 $378 $379 $276 $269 $281 $281 $300 $308 $345 Avg Costs $000 10 11 $346 $357 $381 $393 $318 $333 2019 2020 $377 $323 $366 $4,004 $407 $4,430 $348 $3,794 Month 6 7 1 2 3 4 5 8 9 10 11 12 93 95 98 101 104 108 111 124 130 Orders $000 2018 2019 109 134 117 140 Totals 1307 1586 1170 116 117 123 128 130 117 137 102 134 122 72 148 157 119 2020 138 138 66 75 74 87 92 99 108 Month 6 7 1 2 3 4 5 8 9 10 11 12 Totals 2018 107 108 114 115 114 121 122 127 124 135 129 136 1452 Order Forecast $000 127 135 139 136 147 147 154 162 153 2019 2020 123 146 133 145 164 125 1720 1331 144 73 84 82 95 103 111 110 113 Example Plots: Performance: Actual Orders Monthly Actual Orders $000 157 Monthly Attual Orders 000 10 136 111 10 10 12 2012
Step by Step Solution
There are 3 Steps involved in it

Get step-by-step solutions from verified subject matter experts