

Question: Find the critical value: Determine the test statistic t: t= What is the conclustion For the following claim, find the null and alternative hypotheses, test
Find the critical value:
Determine the test statistic t: t=
What is the conclustion
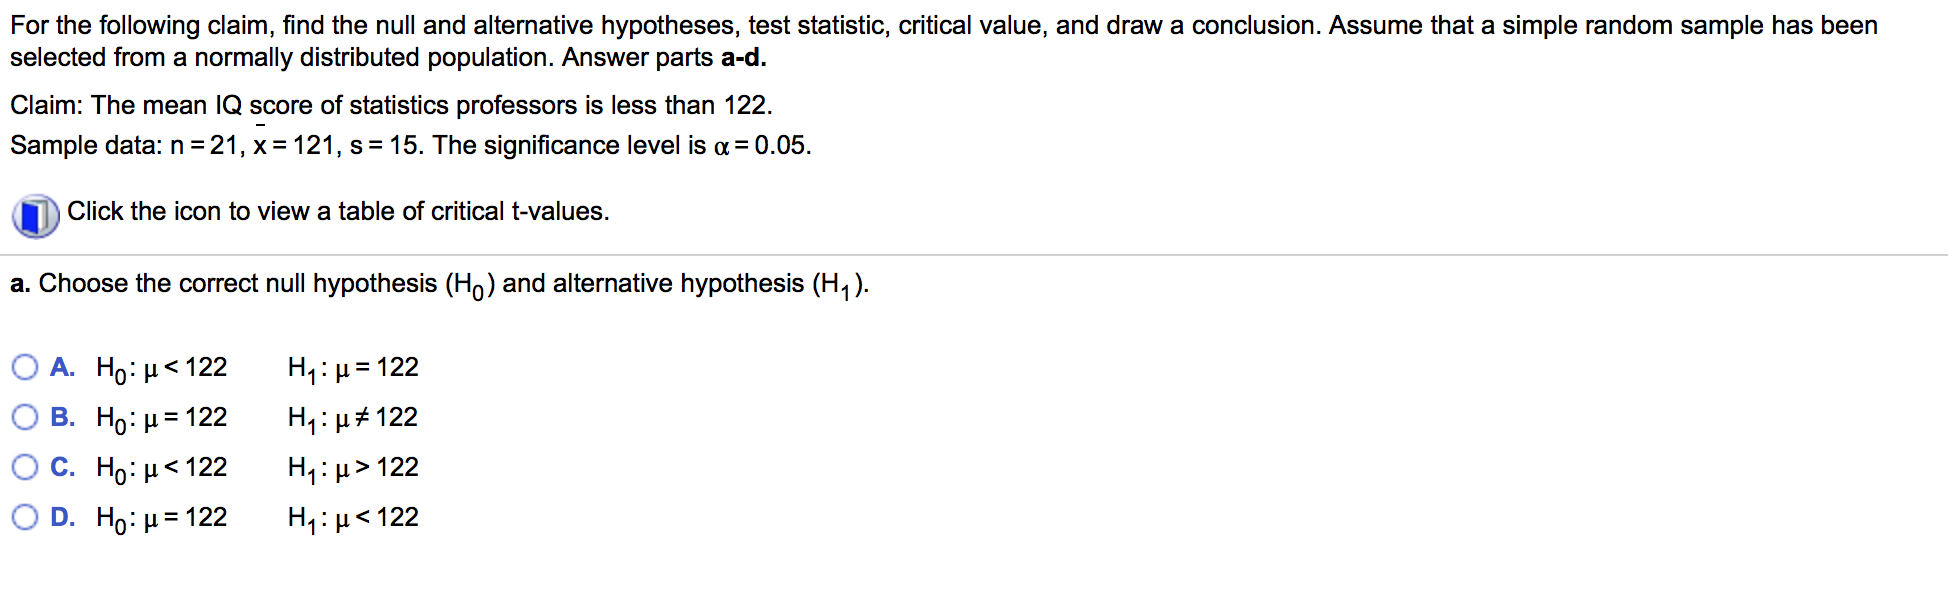
For the following claim, find the null and alternative hypotheses, test statistic, critical value, and draw a conclusion. Assume that a simple random sample has been selected from a normally distributed population. Answer parts a-d. Claim: The mean IQ score of statistics professors is less than 122. Sample data: n = 21, x = 121, s = 15. The significance level is = 0.05. Click the icon to view a table of critical t-values. a. Choose the correct null hypothesis (Ho) and alternative hypothesis (H). A. Ho: < 122 B. Ho: = 122 C. Ho: < 122 O D. Ho: = 122 H:=122 H: #122 H:> 122 H: < 122 For the following claim, find the null and alternative hypotheses, test statistic, critical value, and draw a conclusion. Assume that a simple random sample has been selected from a normally distributed population. Answer parts a-d. Claim: The mean IQ score of statistics professors is less than 122. Sample data: n = 21, x = 121, s = 15. The significance level is = 0.05. Click the icon to view a table of critical t-values. a. Choose the correct null hypothesis (Ho) and alternative hypothesis (H). A. Ho: < 122 B. Ho: = 122 C. Ho: < 122 O D. Ho: = 122 H:=122 H: #122 H:> 122 H: < 122 For the following claim, find the null and alternative hypotheses, test statistic, critical value, and draw a conclusion. Assume that a simple random sample has been selected from a normally distributed population. Answer parts a-d. Claim: The mean IQ score of statistics professors is less than 122. Sample data: n = 21, x = 121, s = 15. The significance level is = 0.05. Click the icon to view a table of critical t-values. a. Choose the correct null hypothesis (Ho) and alternative hypothesis (H). A. Ho: < 122 B. Ho: = 122 C. Ho: < 122 O D. Ho: = 122 H:=122 H: #122 H:> 122 H: < 122 For the following claim, find the null and alternative hypotheses, test statistic, critical value, and draw a conclusion. Assume that a simple random sample has been selected from a normally distributed population. Answer parts a-d. Claim: The mean IQ score of statistics professors is less than 122. Sample data: n = 21, x = 121, s = 15. The significance level is = 0.05. Click the icon to view a table of critical t-values. a. Choose the correct null hypothesis (Ho) and alternative hypothesis (H). A. Ho: < 122 B. Ho: = 122 C. Ho: < 122 O D. Ho: = 122 H:=122 H: #122 H:> 122 H: < 122
Step by Step Solution
3.33 Rating (147 Votes )
There are 3 Steps involved in it
Given that u 122 n 21 X 121 S 15 Ho Null hyp... View full answer

Get step-by-step solutions from verified subject matter experts