Question: Find the demand, capacity, and utilization for Q2 2018 for each process step. This can be displayed in a table within the report. Please provide
Find the demand, capacity, and utilization for Q2 2018 for each process step. This can be displayed in a table within the report. Please provide sample calculations in the appendix. (Exhibits below)
a. Find the demand (number of applications sent in from potential customers) per day for each of the following steps: data entry, initial review, evaluate and price risk, print and mail for simple applications. To find the demand, use the data given in the case from Q2 2018, and assume 13 weeks in a quarter and 5 days in a week.
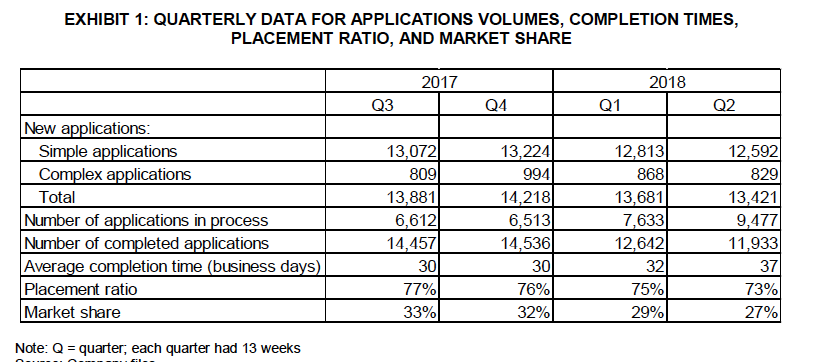
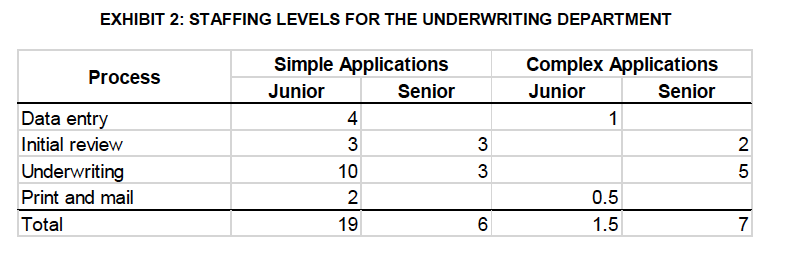
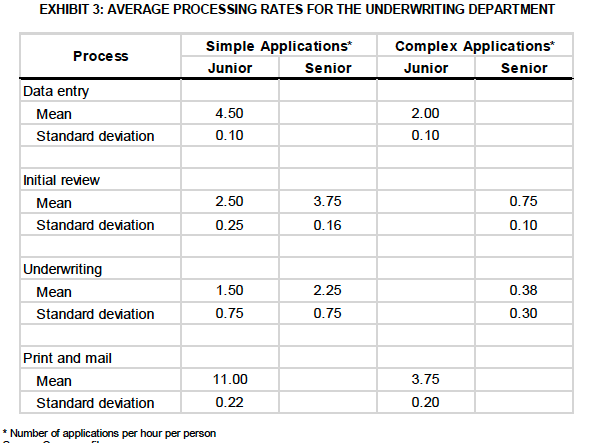
EXHIBIT 1: QUARTERLY DATA FOR APPLICATIONS VOLUMES, COMPLETION TIMES, PLACEMENT RATIO, AND MARKET SHARE 2017 2018 Q3 Q4 Q1 Q2 New applications: Simple applications Complex applications Total Number of applications in process Number of completed applications Average completion time (business days) Placement ratio Market share 13,0721 809 13,881 6,612 14,457) 30 77% 33% 13,224 994 14,218 6,513 14,536 12,813 868 13,681 7,633) 12,642 32 75% 29% 12,592 829 13,421 9,477 11,933 37 73% 27% 30 76% 32% Note: Q = quarter, each quarter had 13 weeks EXHIBIT 2: STAFFING LEVELS FOR THE UNDERWRITING DEPARTMENT Process Complex Applications Junior Senior 1 Simple Applications Junior Senior 4 3 10 2 19 Data entry Initial review Underwriting Print and mail Total 2 3 3 0.5 1.5 6 7 EXHIBIT 3: AVERAGE PROCESSING RATES FOR THE UNDERWRITING DEPARTMENT Process Simple Applications Junior Senior Complex Applications Junior Senior Data entry Mean Standard deviation 4.50 0.10 2.00 0.10 Initial review Mean Standard deviation 2.50 0.75 3.75 0.16 0.25 0.10 Underwriting Mean Standard deviation 1.50 0.75 2.25 0.75 0.38 0.30 Print and mail Mean 11.00 Standard deviation 0.22 * Number of applications per hour per person 3.75 0.20 EXHIBIT 1: QUARTERLY DATA FOR APPLICATIONS VOLUMES, COMPLETION TIMES, PLACEMENT RATIO, AND MARKET SHARE 2017 2018 Q3 Q4 Q1 Q2 New applications: Simple applications Complex applications Total Number of applications in process Number of completed applications Average completion time (business days) Placement ratio Market share 13,0721 809 13,881 6,612 14,457) 30 77% 33% 13,224 994 14,218 6,513 14,536 12,813 868 13,681 7,633) 12,642 32 75% 29% 12,592 829 13,421 9,477 11,933 37 73% 27% 30 76% 32% Note: Q = quarter, each quarter had 13 weeks EXHIBIT 2: STAFFING LEVELS FOR THE UNDERWRITING DEPARTMENT Process Complex Applications Junior Senior 1 Simple Applications Junior Senior 4 3 10 2 19 Data entry Initial review Underwriting Print and mail Total 2 3 3 0.5 1.5 6 7 EXHIBIT 3: AVERAGE PROCESSING RATES FOR THE UNDERWRITING DEPARTMENT Process Simple Applications Junior Senior Complex Applications Junior Senior Data entry Mean Standard deviation 4.50 0.10 2.00 0.10 Initial review Mean Standard deviation 2.50 0.75 3.75 0.16 0.25 0.10 Underwriting Mean Standard deviation 1.50 0.75 2.25 0.75 0.38 0.30 Print and mail Mean 11.00 Standard deviation 0.22 * Number of applications per hour per person 3.75 0.20


