

Question: Find the expected returns, standard deviations, and coefficients of variations for the assets in Table 2-1, then rank the assets from least risky to most
Find the expected returns, standard deviations, and coefficients of variations for the assets in Table 2-1, then rank the assets from least risky to most risky based on their deviations and CVs. Discuss the pros and cons for using deviations and/or CV as a measure of investment risk. If data were shown for an index fund designed to mirror the market, would the best guess as to its expected return and deviation be equal to the expected return and deviation of the market?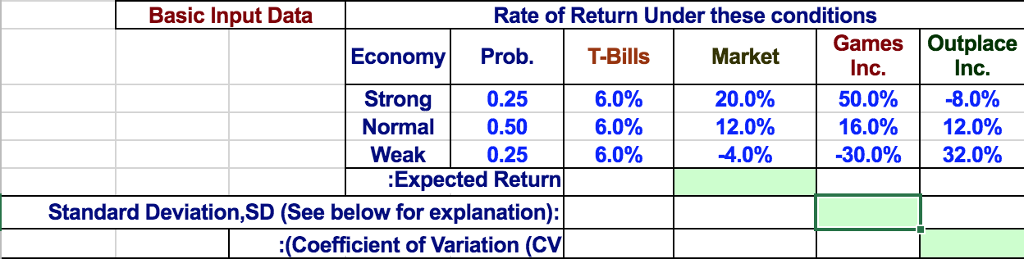
Basic Input Data Rate of Return Under these conditions Games Outplace Economy Prob. T-Bills Market Inc. Inc. Strong 0.25 6.0% 20.0% 50.0% -8.0% Normal 0.50 6.0% 12.0% 16.0% 12.0% Weak 0.25 6.0% 4.0% -30.0% 32.0% :Expected Return Standard Deviation, SD (See below for explanation): (Coefficient of Variation (CV
Step by Step Solution
There are 3 Steps involved in it

Get step-by-step solutions from verified subject matter experts