

Question: find the least squares regression line treating cola consumption per week as the explanatory variable E Homework: Module 2 Homework Set C Question 18, 4.2.23-T
find the least squares regression line treating cola consumption per week as the explanatory variable
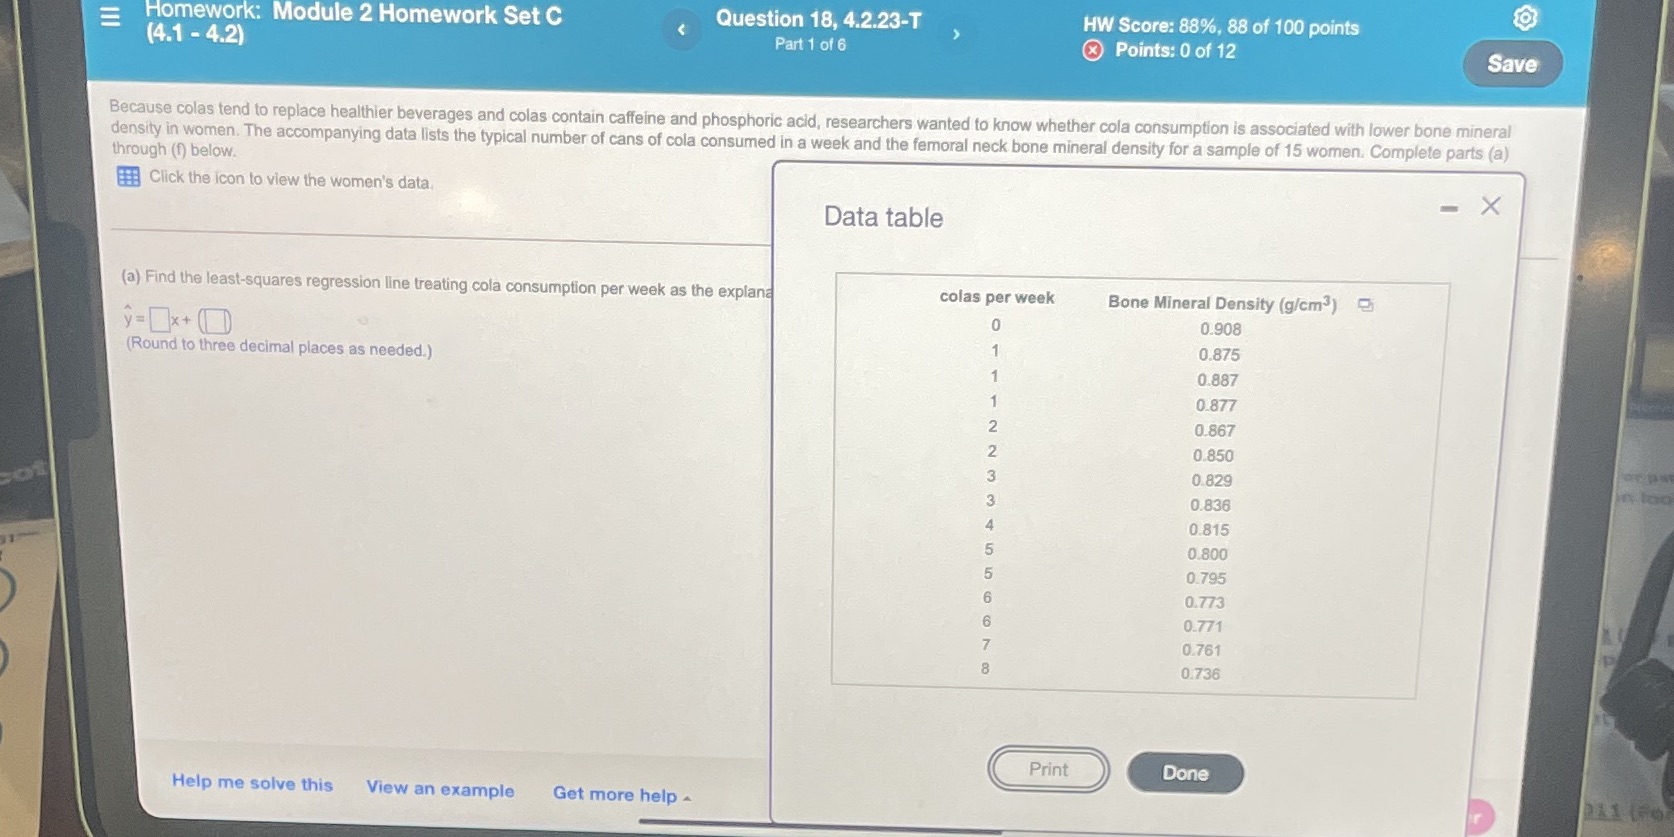
E Homework: Module 2 Homework Set C Question 18, 4.2.23-T HW Score: 88%, 88 of 100 points (4.1 - 4.2) Part 1 of 6 Points: 0 of 12 Save Because colas tend to replace healthier beverages and colas contain caffeine and phosphoric acid, researchers wanted to know whether cola consumption is associated with lower bone mineral density in women. The accompanying data lists the typical number of cans of cola consumed in a week and the femoral neck bone mineral density for a sample of 15 women. Complete parts (a) through (f) below. Click the icon to view the women's data - X Data table (a) Find the least-squares regression line treating cola consumption per week as the explana colas per week Bone Mineral Density (g/cm]) y =x + 0.908 (Round to three decimal places as needed.) 0.875 0.887 0.877 0.867 0.850 0.829 in lag 0.836 0.815 0.800 0.795 0.773 0.771 0.761 0.736 Print Done Help me solve this View an example Get more help
Step by Step Solution
There are 3 Steps involved in it

Get step-by-step solutions from verified subject matter experts