

Question: Find the mean for the given sample data..Unless indicated otherwise, round your answer to one more decimal place than is present in the original data
Find the mean for the given sample data..Unless indicated otherwise, round your answer to one more decimal place than is present in the original data values. The students in
Hugh Logan's math class took the Scholastic Aptitude Test. Their math scores are shown
536 608 344 340 5%below. Find the mean score.357 343 566 470 482
464.2
476.0
473.7
455.1
Question 2
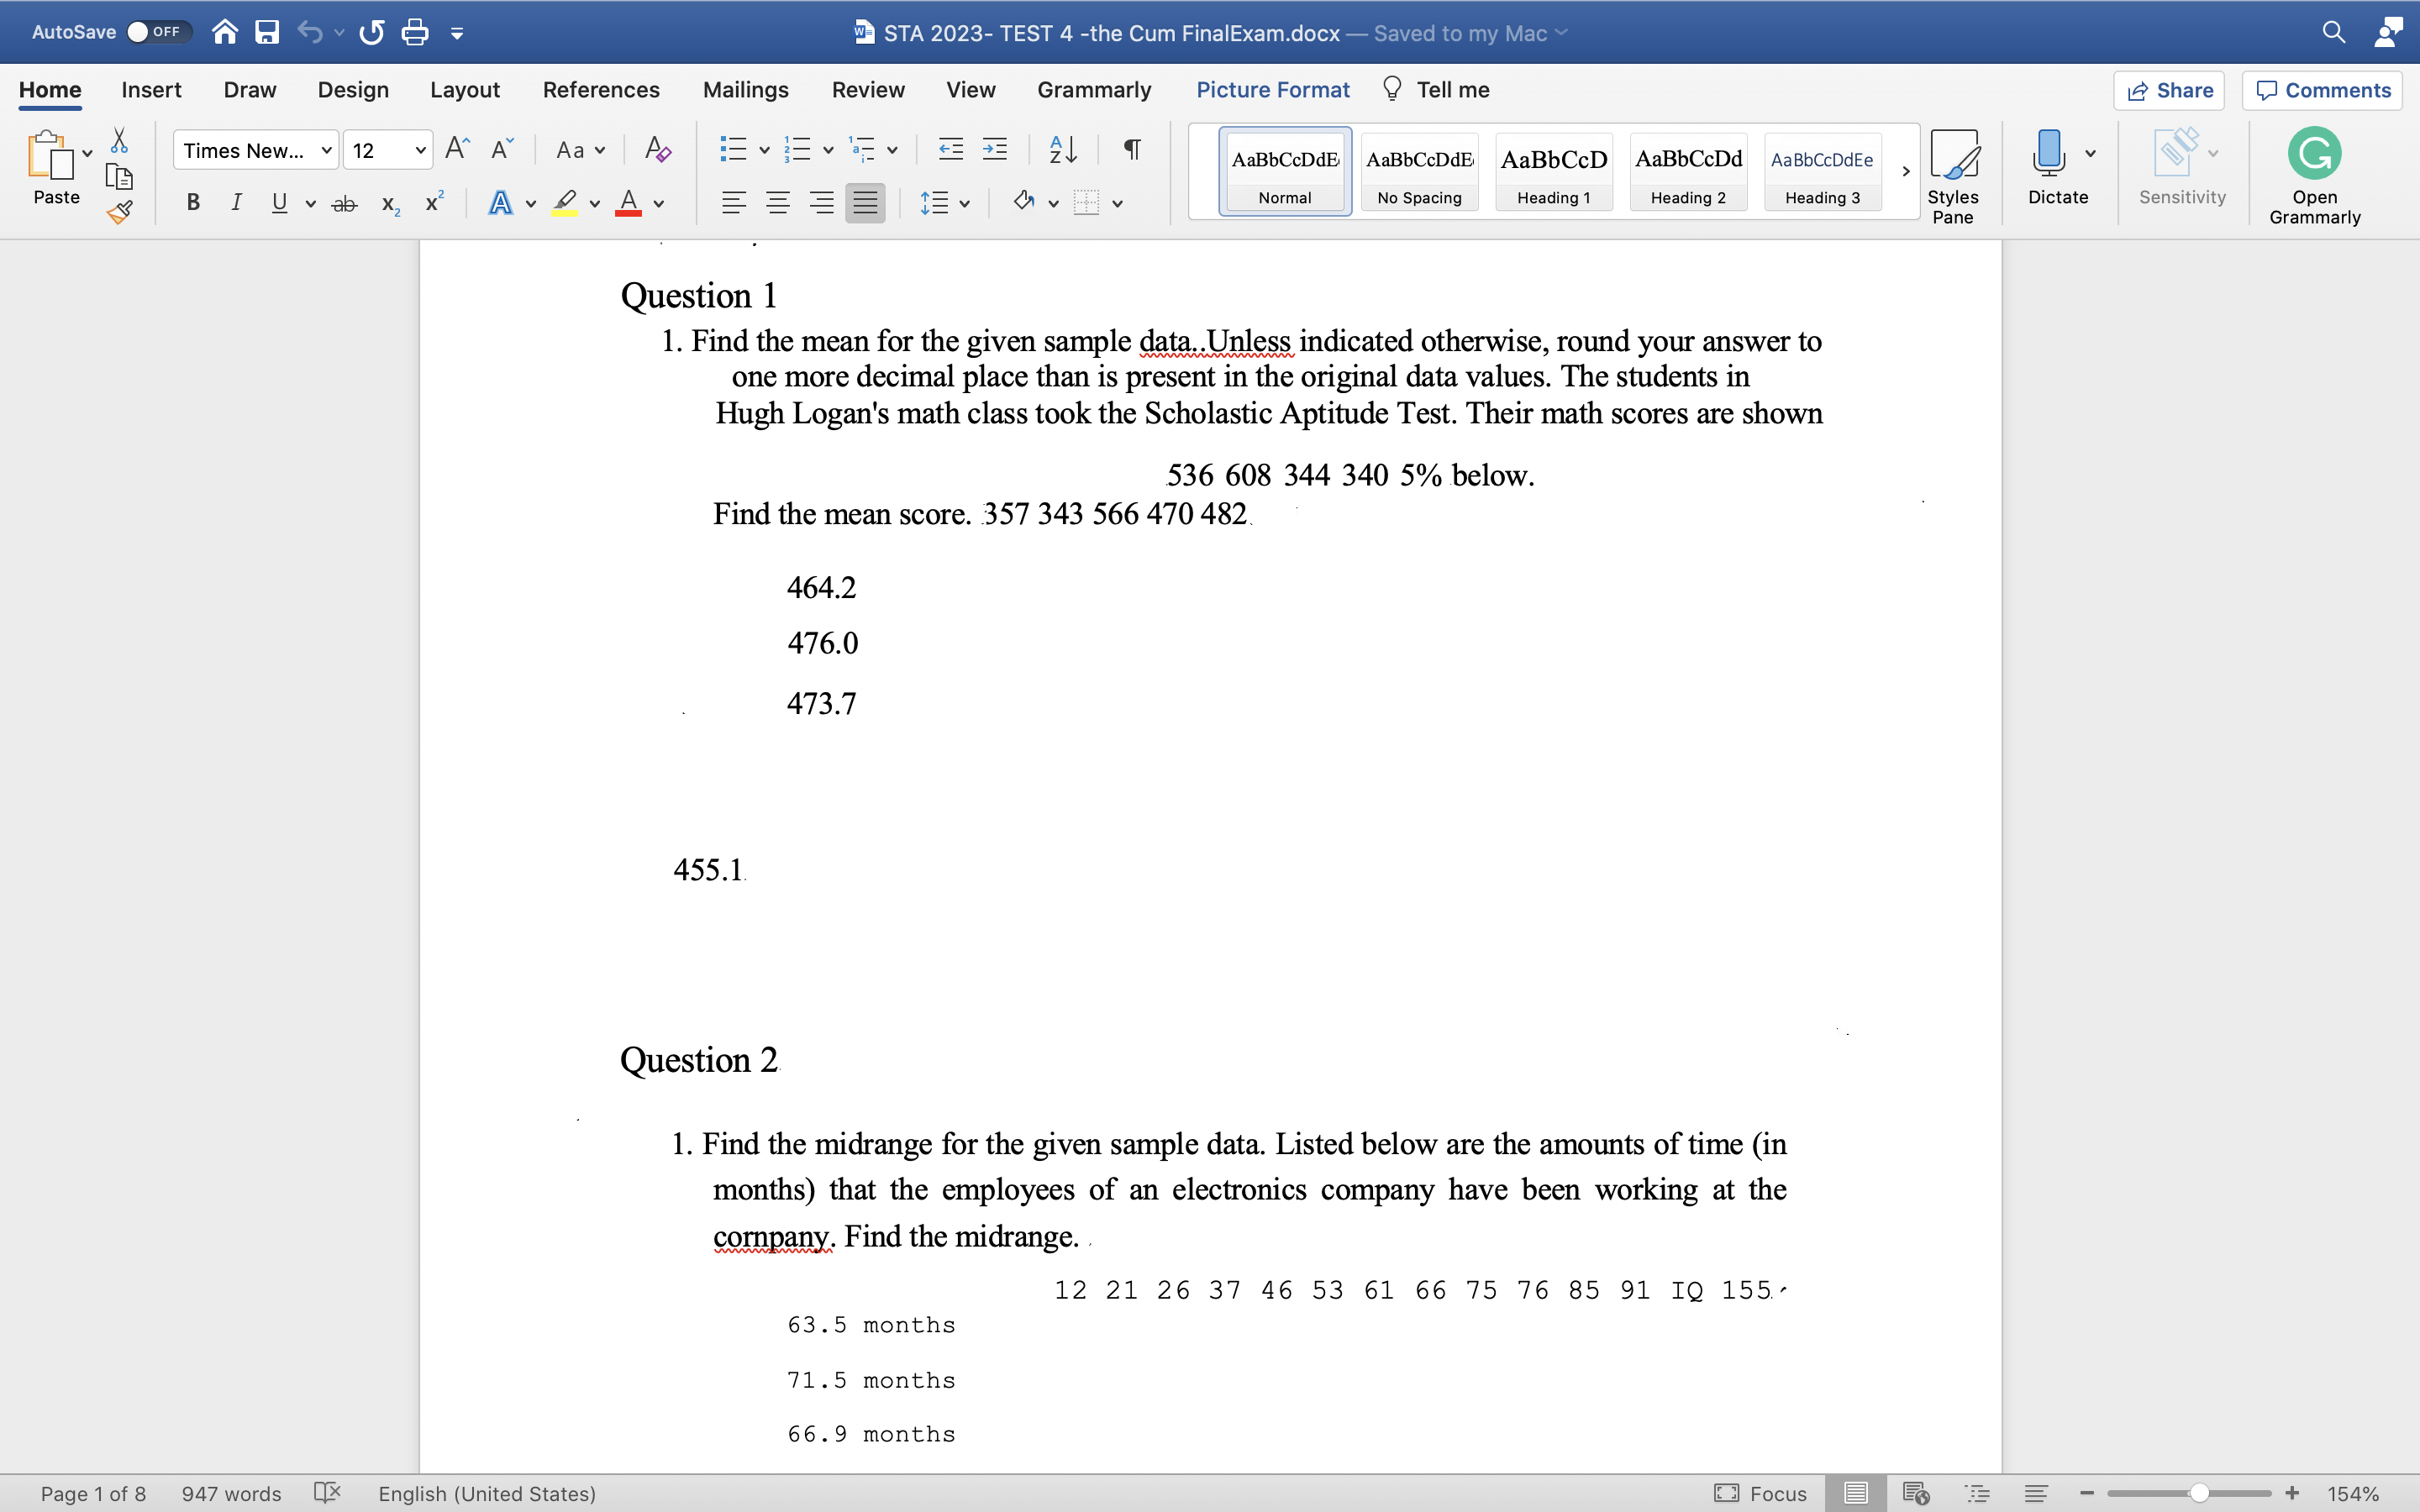
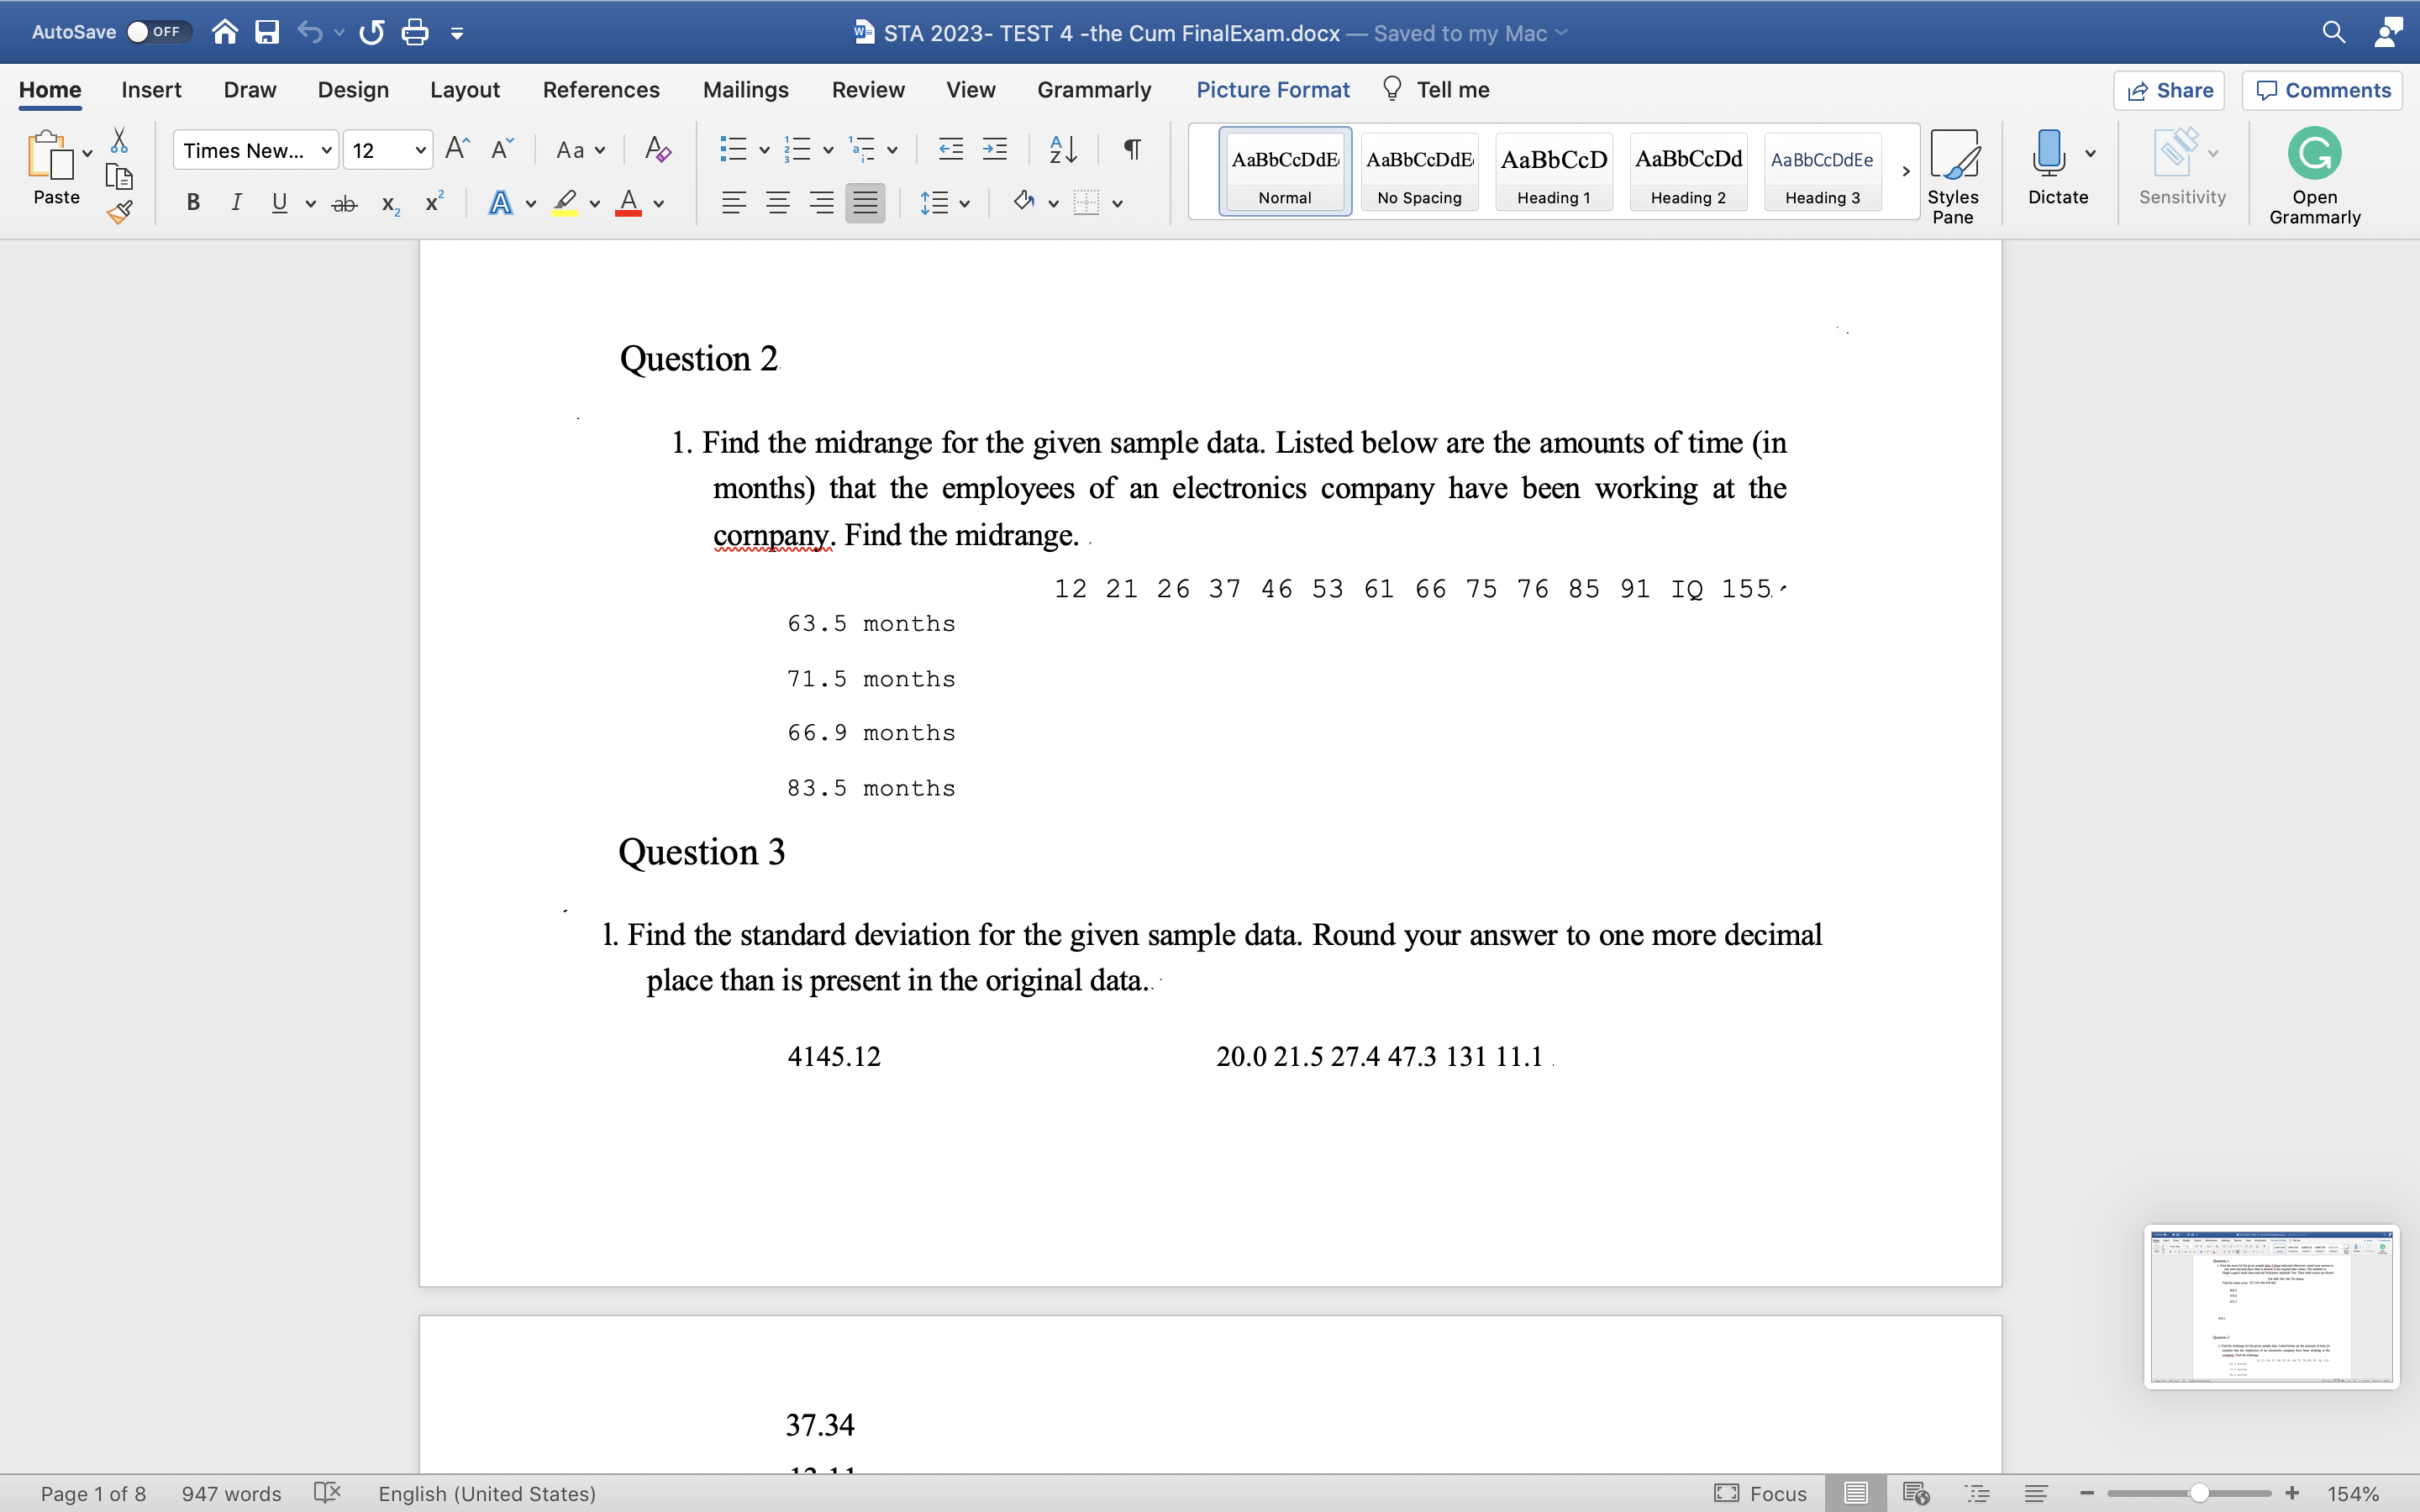
1. Find the midrange for the given sample data. Listed below are the amounts of time (in months) that the employees of an electronics company have been working at the cornpany. Find the midrange.
12 21 26 37 46 53 61 66 75 76 85 91 IQ 155
63.5 months
71.5 months
66.9 months
83.5 months
Question 3
l. Find the standard deviation for the given sample data. Round your answer to one more decimal place than is present in the original data.
4145.1220.0 21.5 27.4 47.3 131 11.1
37.34
13.11
3285.46
Question 4
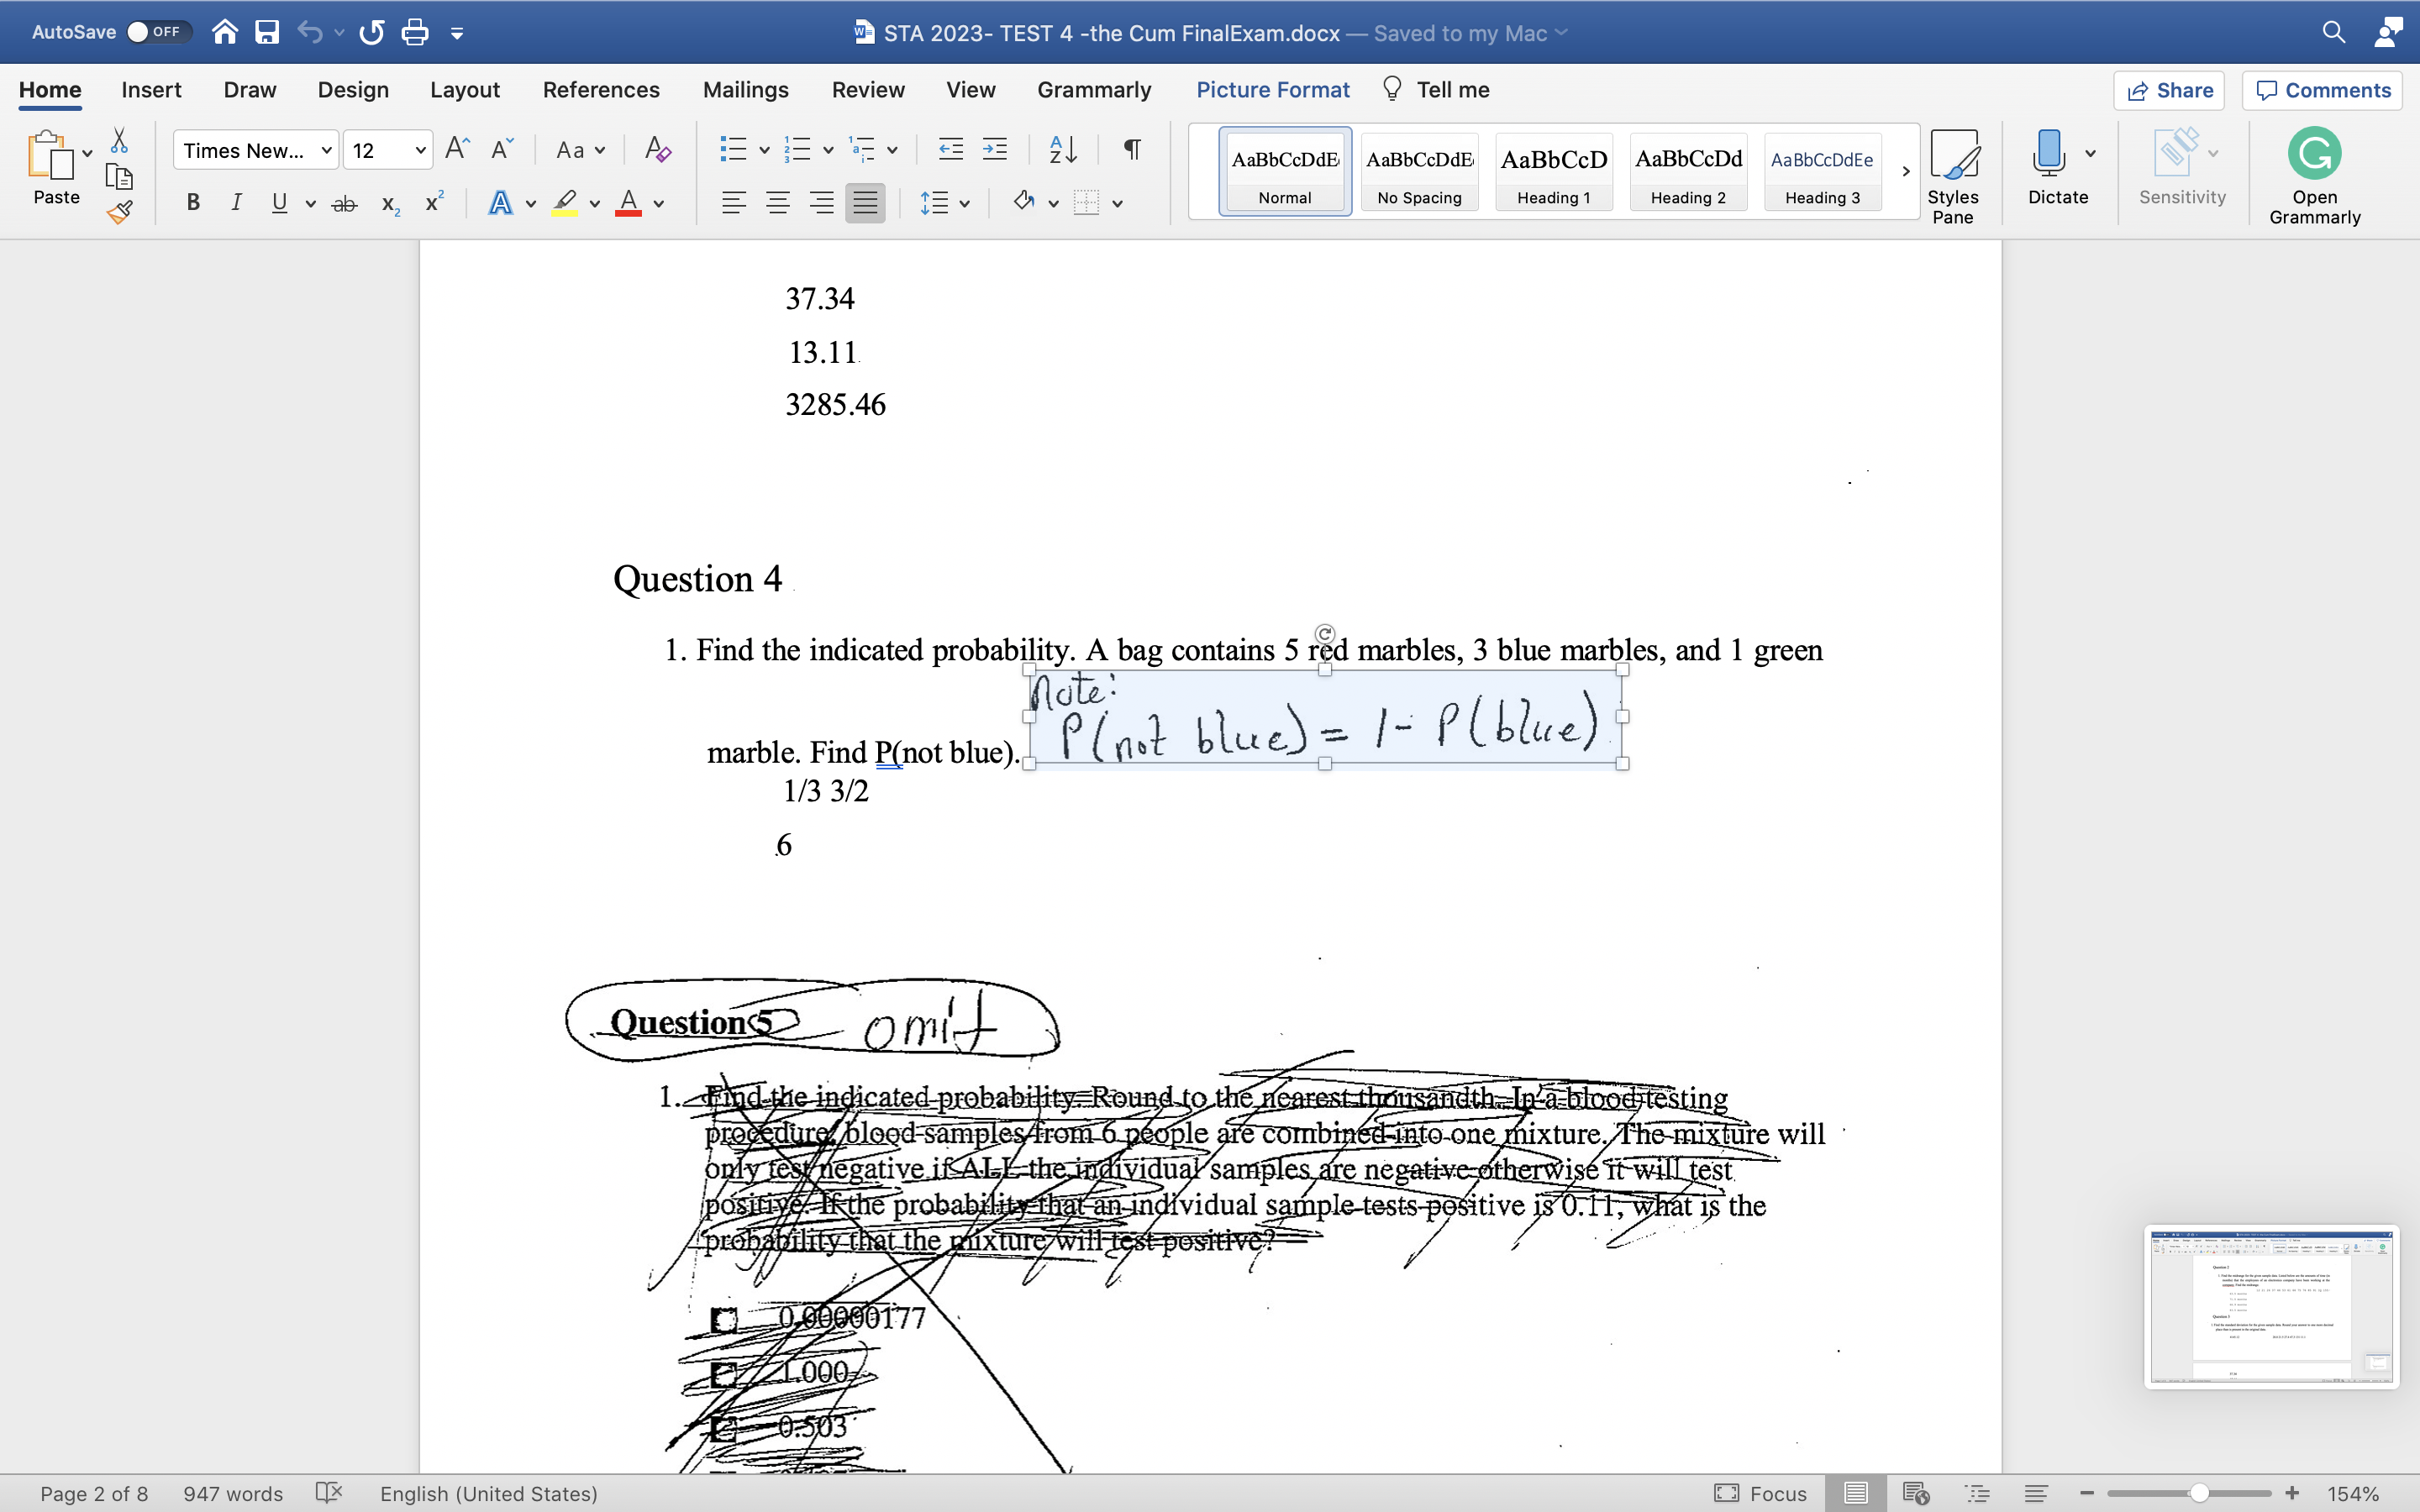
1. Find the indicated probability. A bag contains 5 red marbles, 3 blue marbles, and 1 green
marble. Find P(not blue).P(not blue)=1-p(blue)
1/3 3/2
6
Question 5
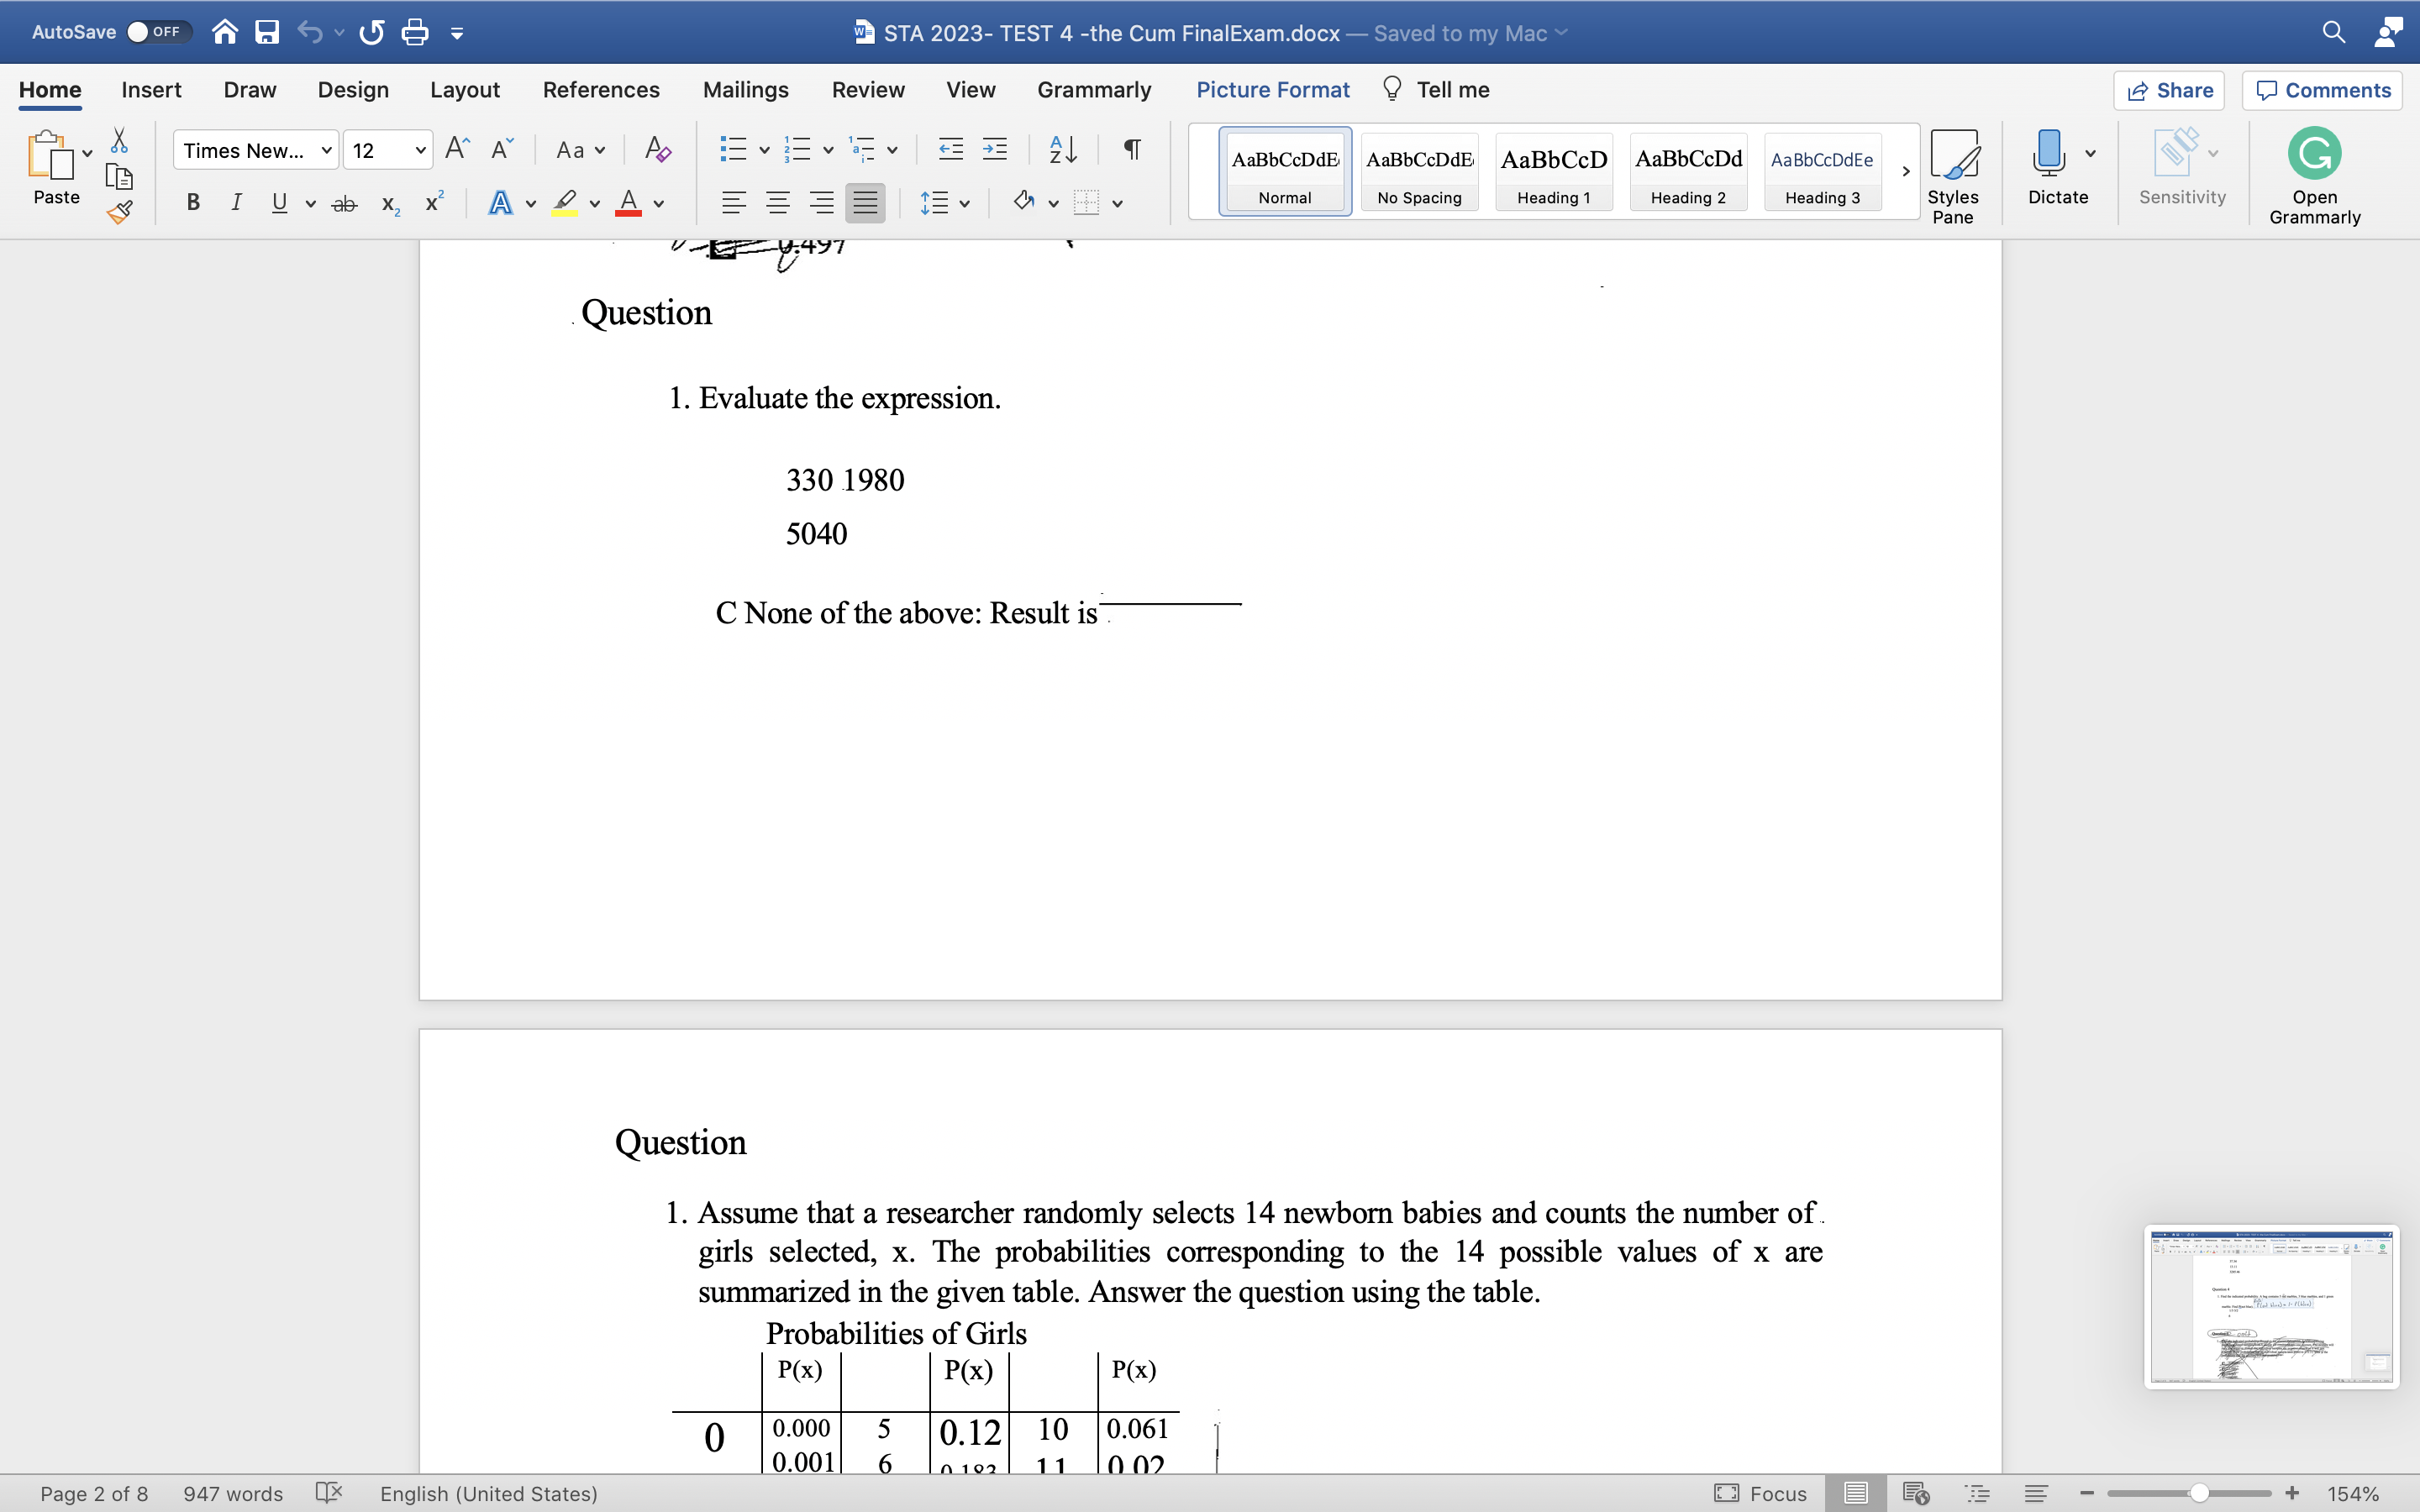
1. Evaluate the expression.
330198 0
5040
C None of the above: Result is------------
Question 6
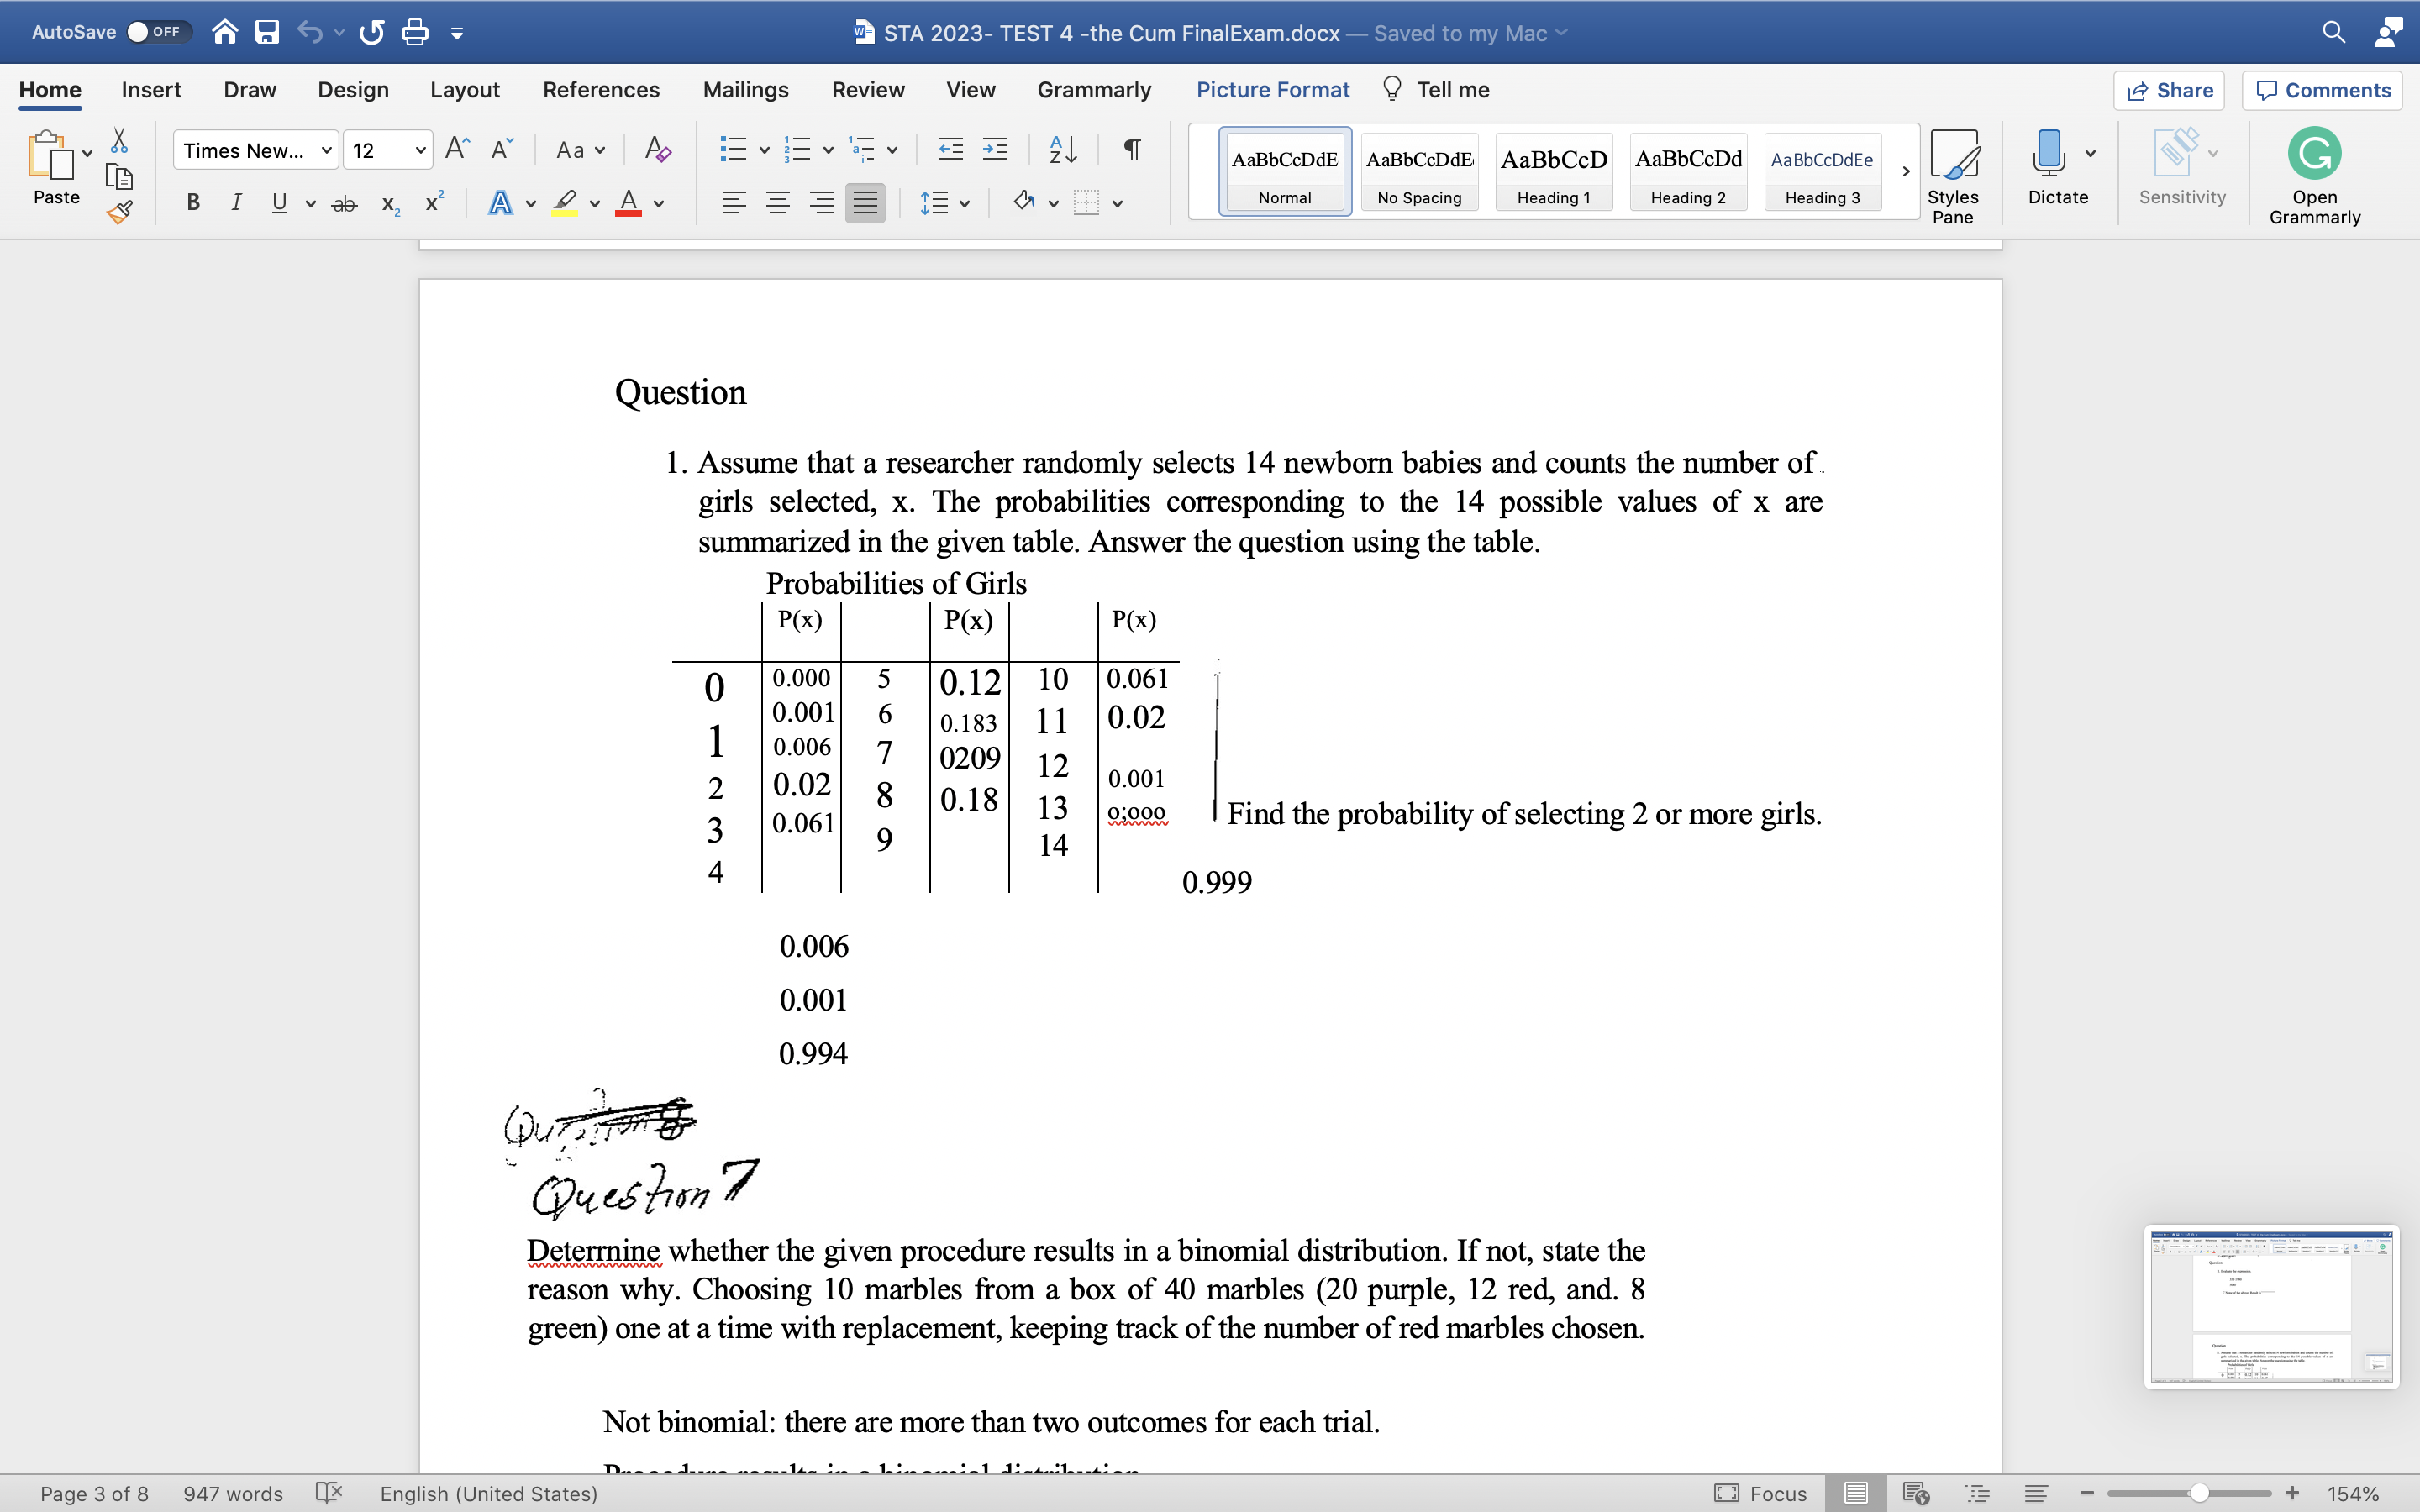
1. Assume that a researcher randomly selects 14 newborn babies and counts the number ofgirls selected, x. The probabilities corresponding to the 14 possible values of x are summarized in the given table. Answer the question using the table.
Probabilities of Girls
P(x)
P(x)
P(x)
0
1
2
3
4
0.000
0.001
0.006
0.02
0.061
5
6
7
8
9
0.12
0.183
0209
0.18
10
11
12
13
14
0.061
0.02
0.001 o;ooo
Find the probability of selecting 2 or more girls.
0.999
0.006
0.001
0.994
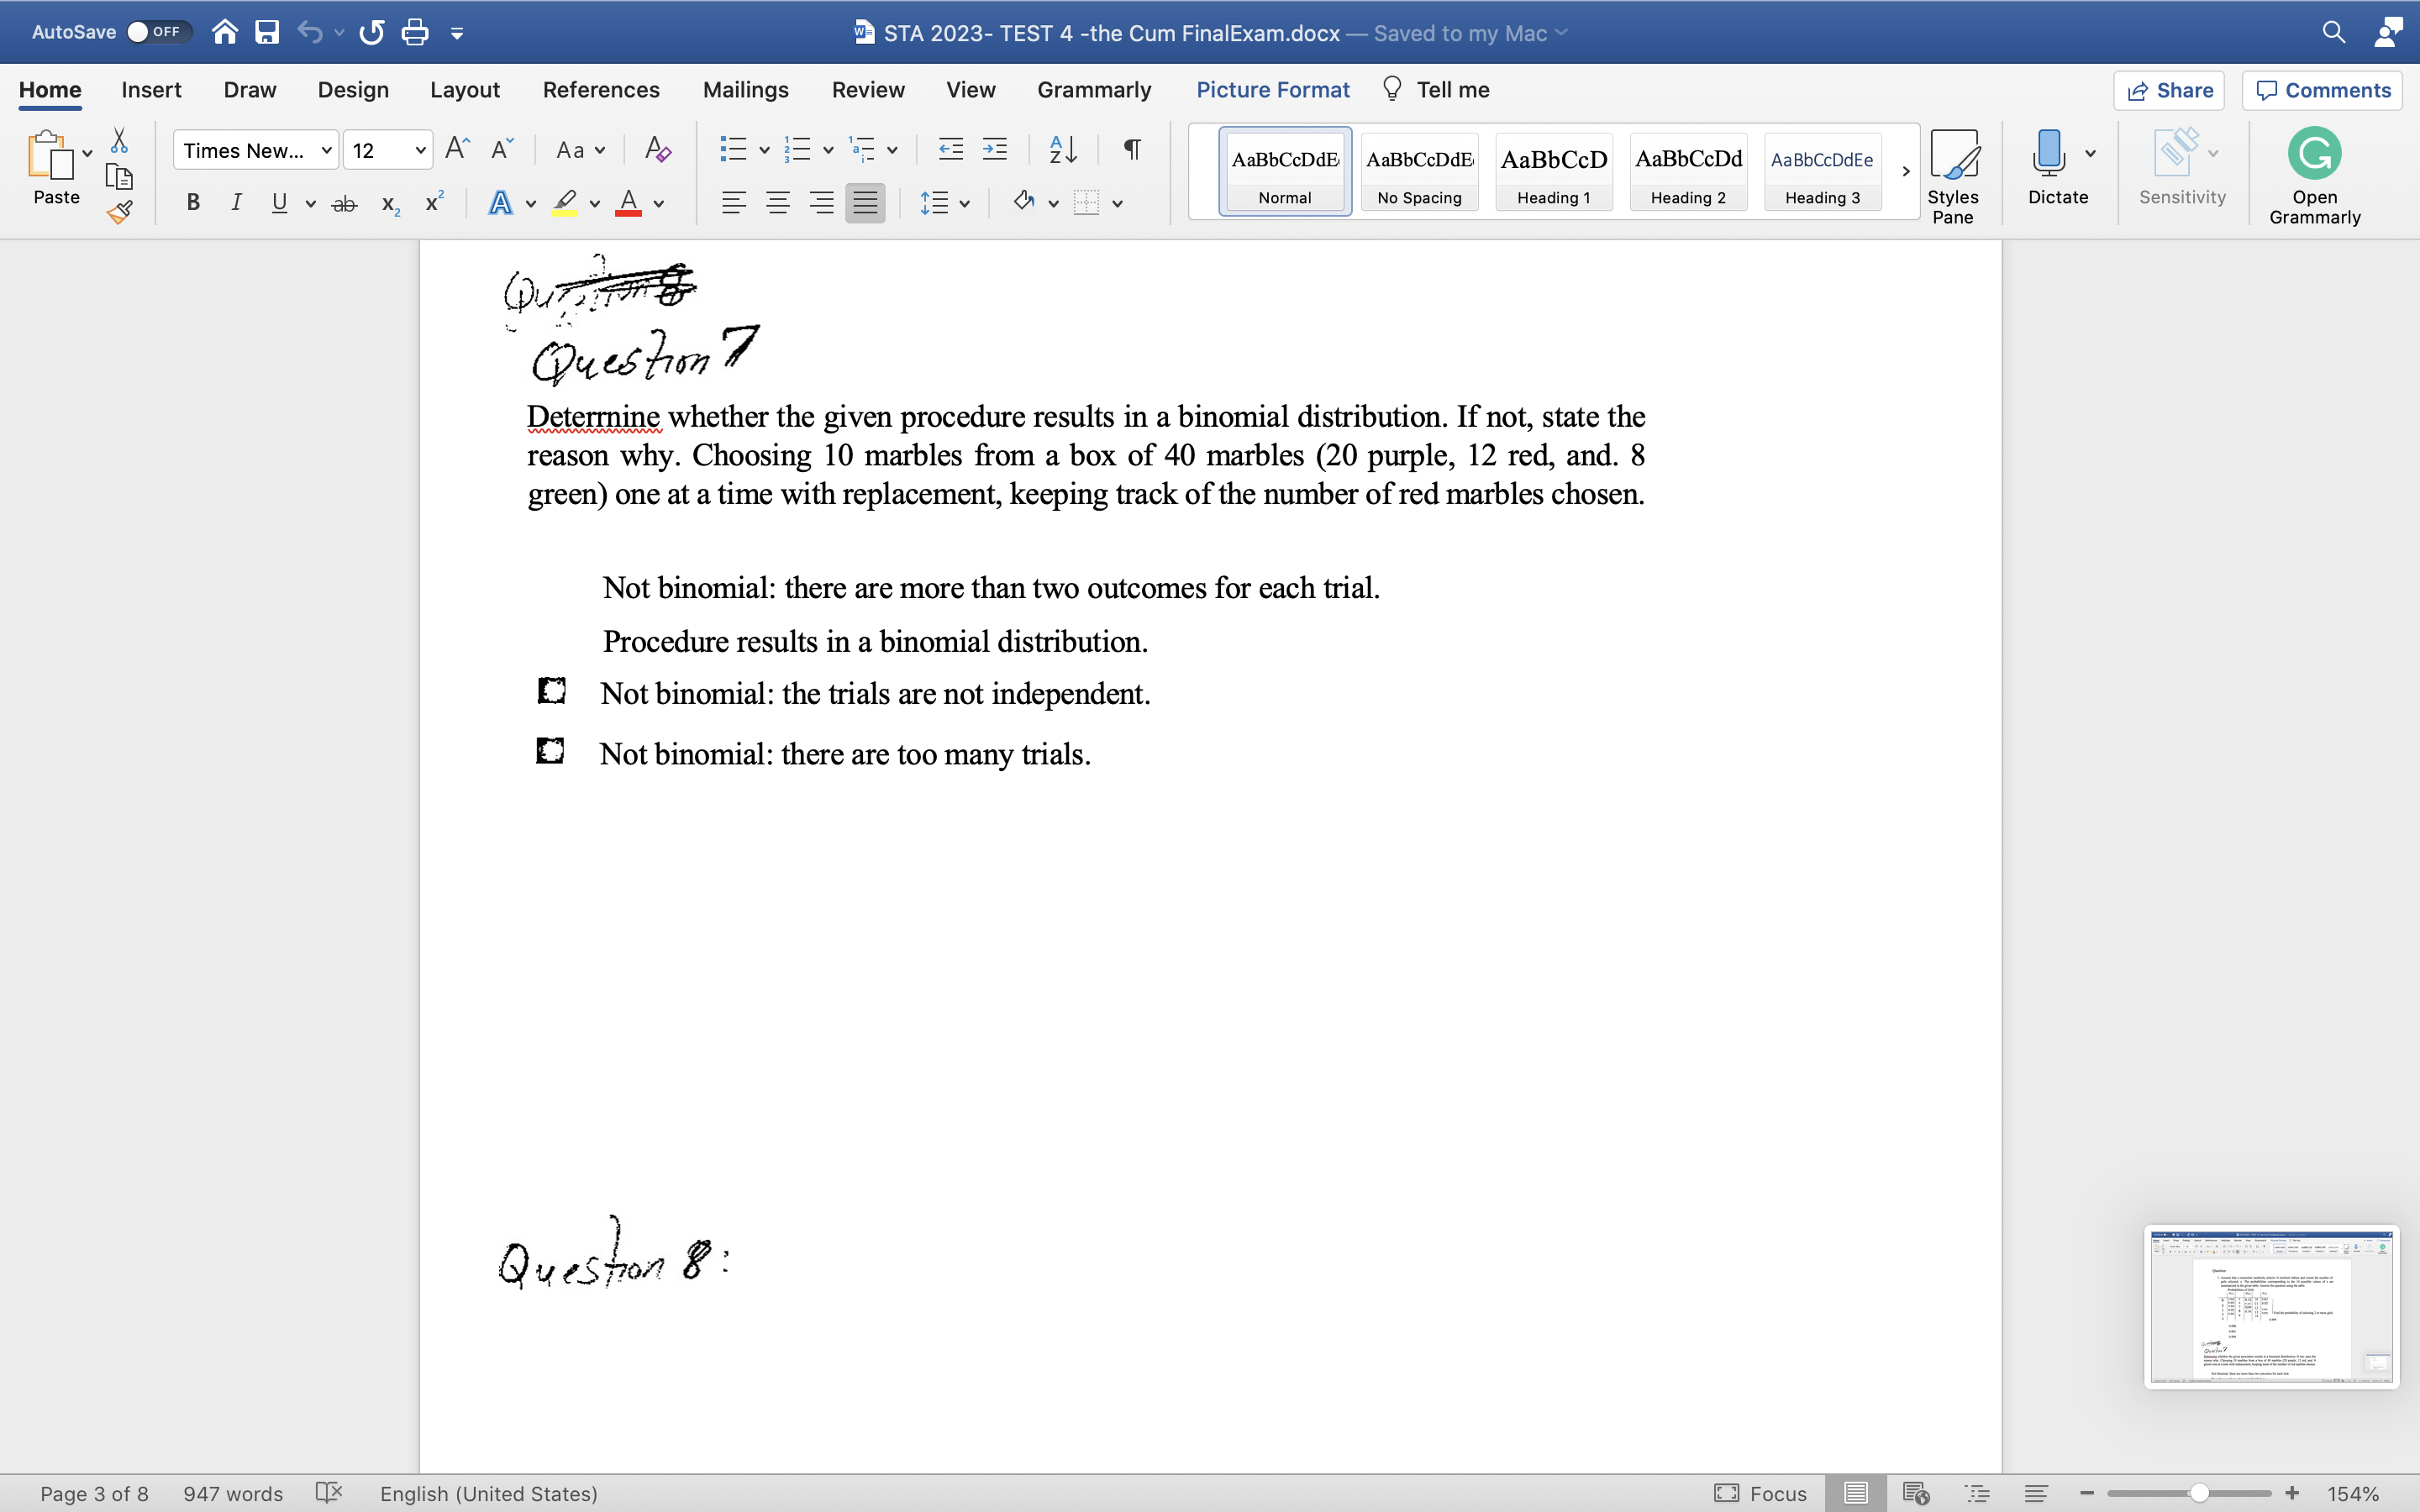
Deterrnine whether the given procedure results in a binomial distribution. If not, state the reason why. Choosing 10 marbles from a box of 40 marbles (20 purple, 12 red, and. 8 green) one at a time with replacement, keeping track of the number of red marbles chosen.
Not binomial: there are more than two outcomes for each trial.
Procedure results in a binomial distribution.
Not binomial: the trials are not independent.
Not binomial: there are too many trials.
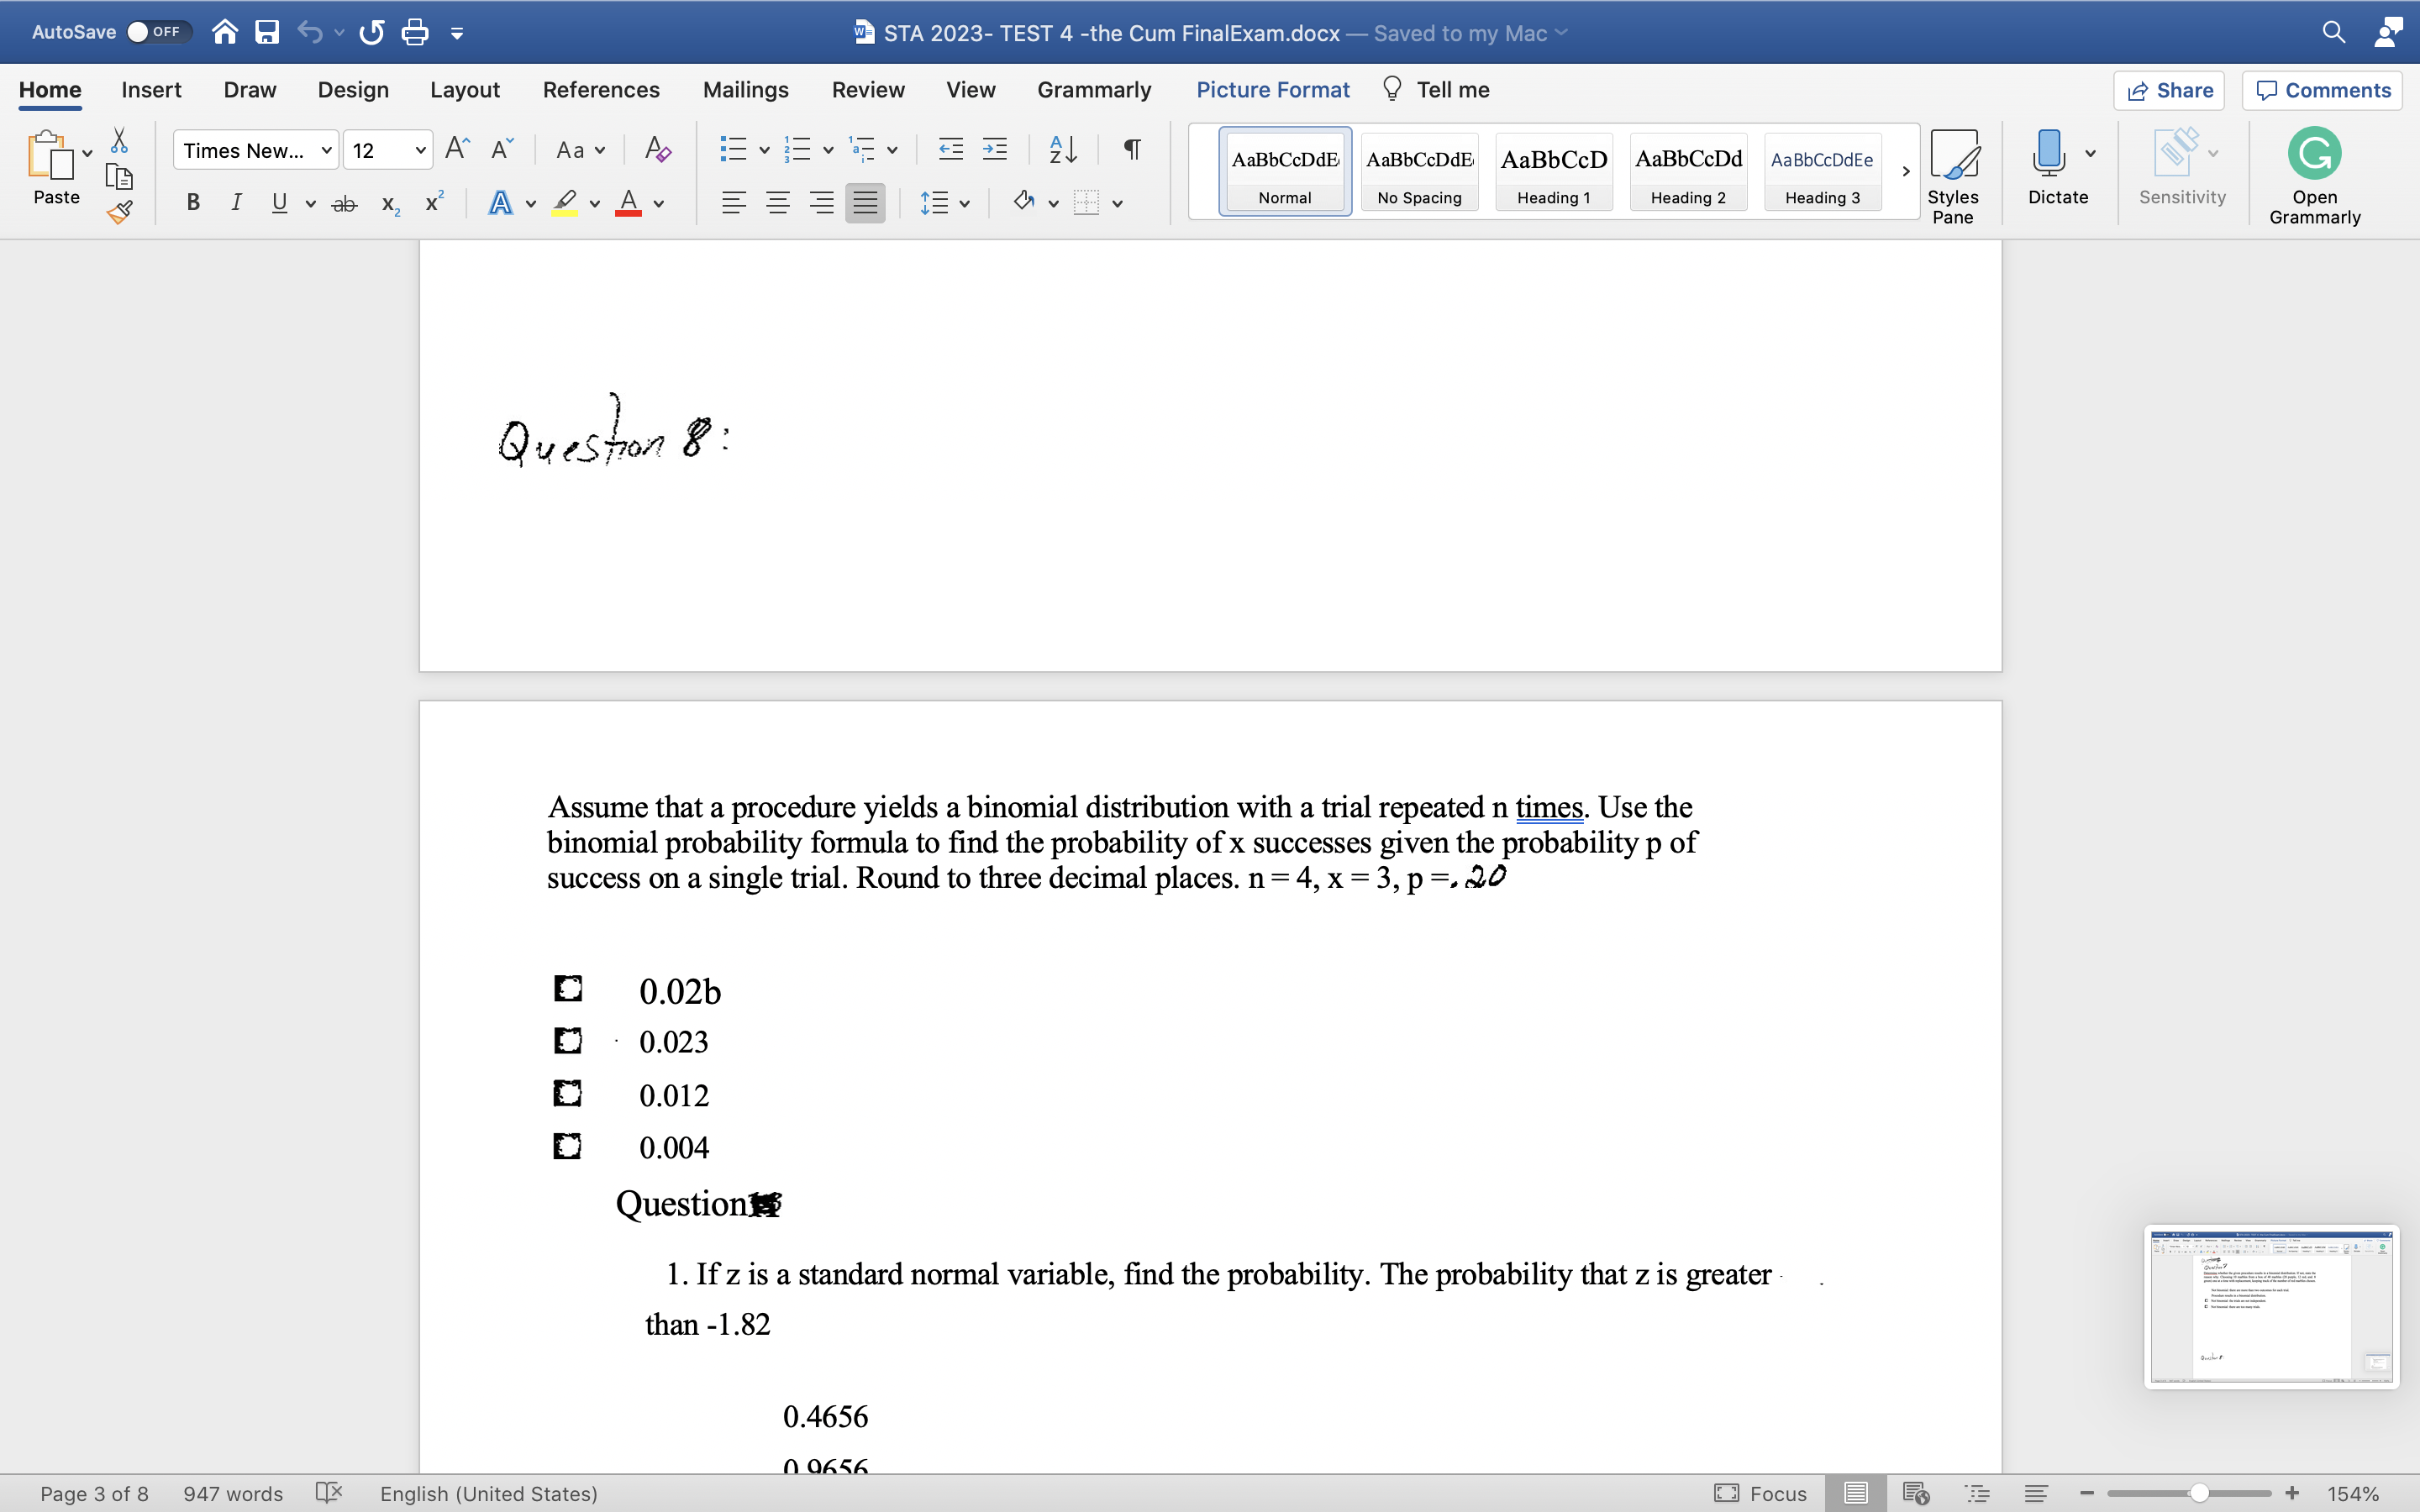
Assume that a procedure yields a binomial distribution with a trial repeated n times. Use the binomial probability formula to find the probability of x successes given the probability p of success on a single trial. Round to three decimal places. n = 4, x = 3, p =
0.02b
0.023
0.012
0.004
Question
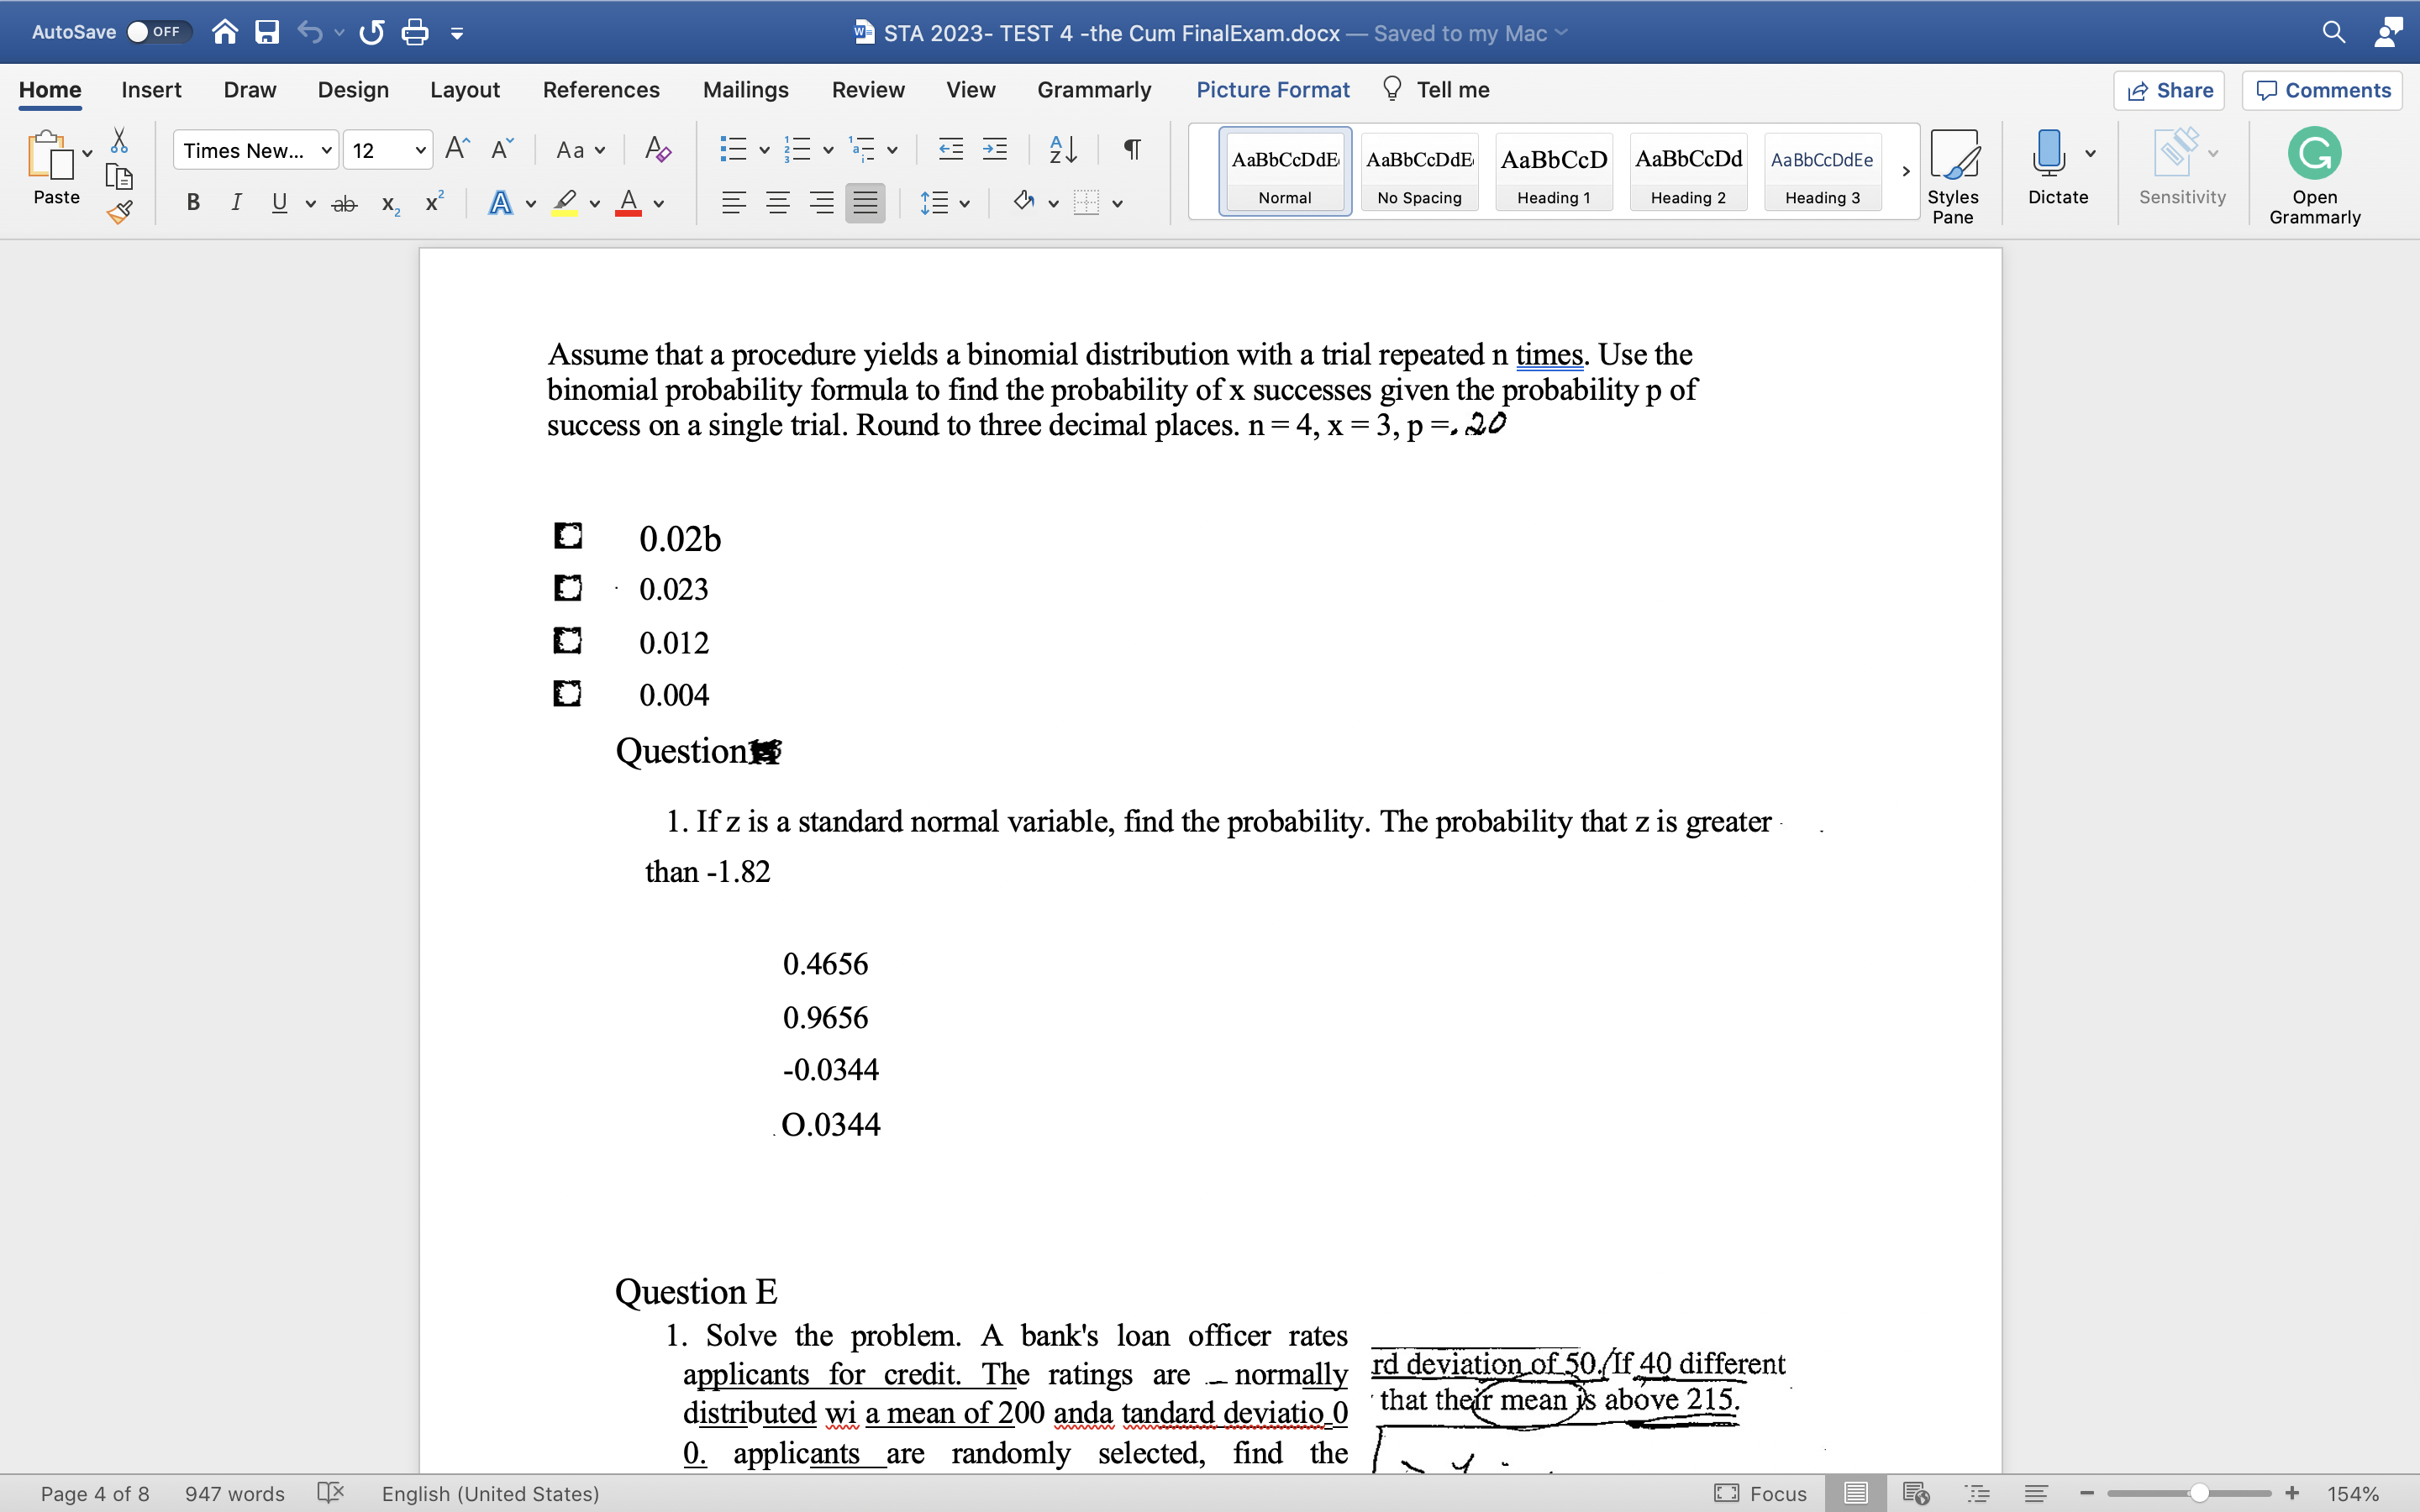
1. If z is a standard normal variable, find the probability. The probability that z is greaterthan -1.82
0.4656
0.9656
-0.0344
O.0344
Question E
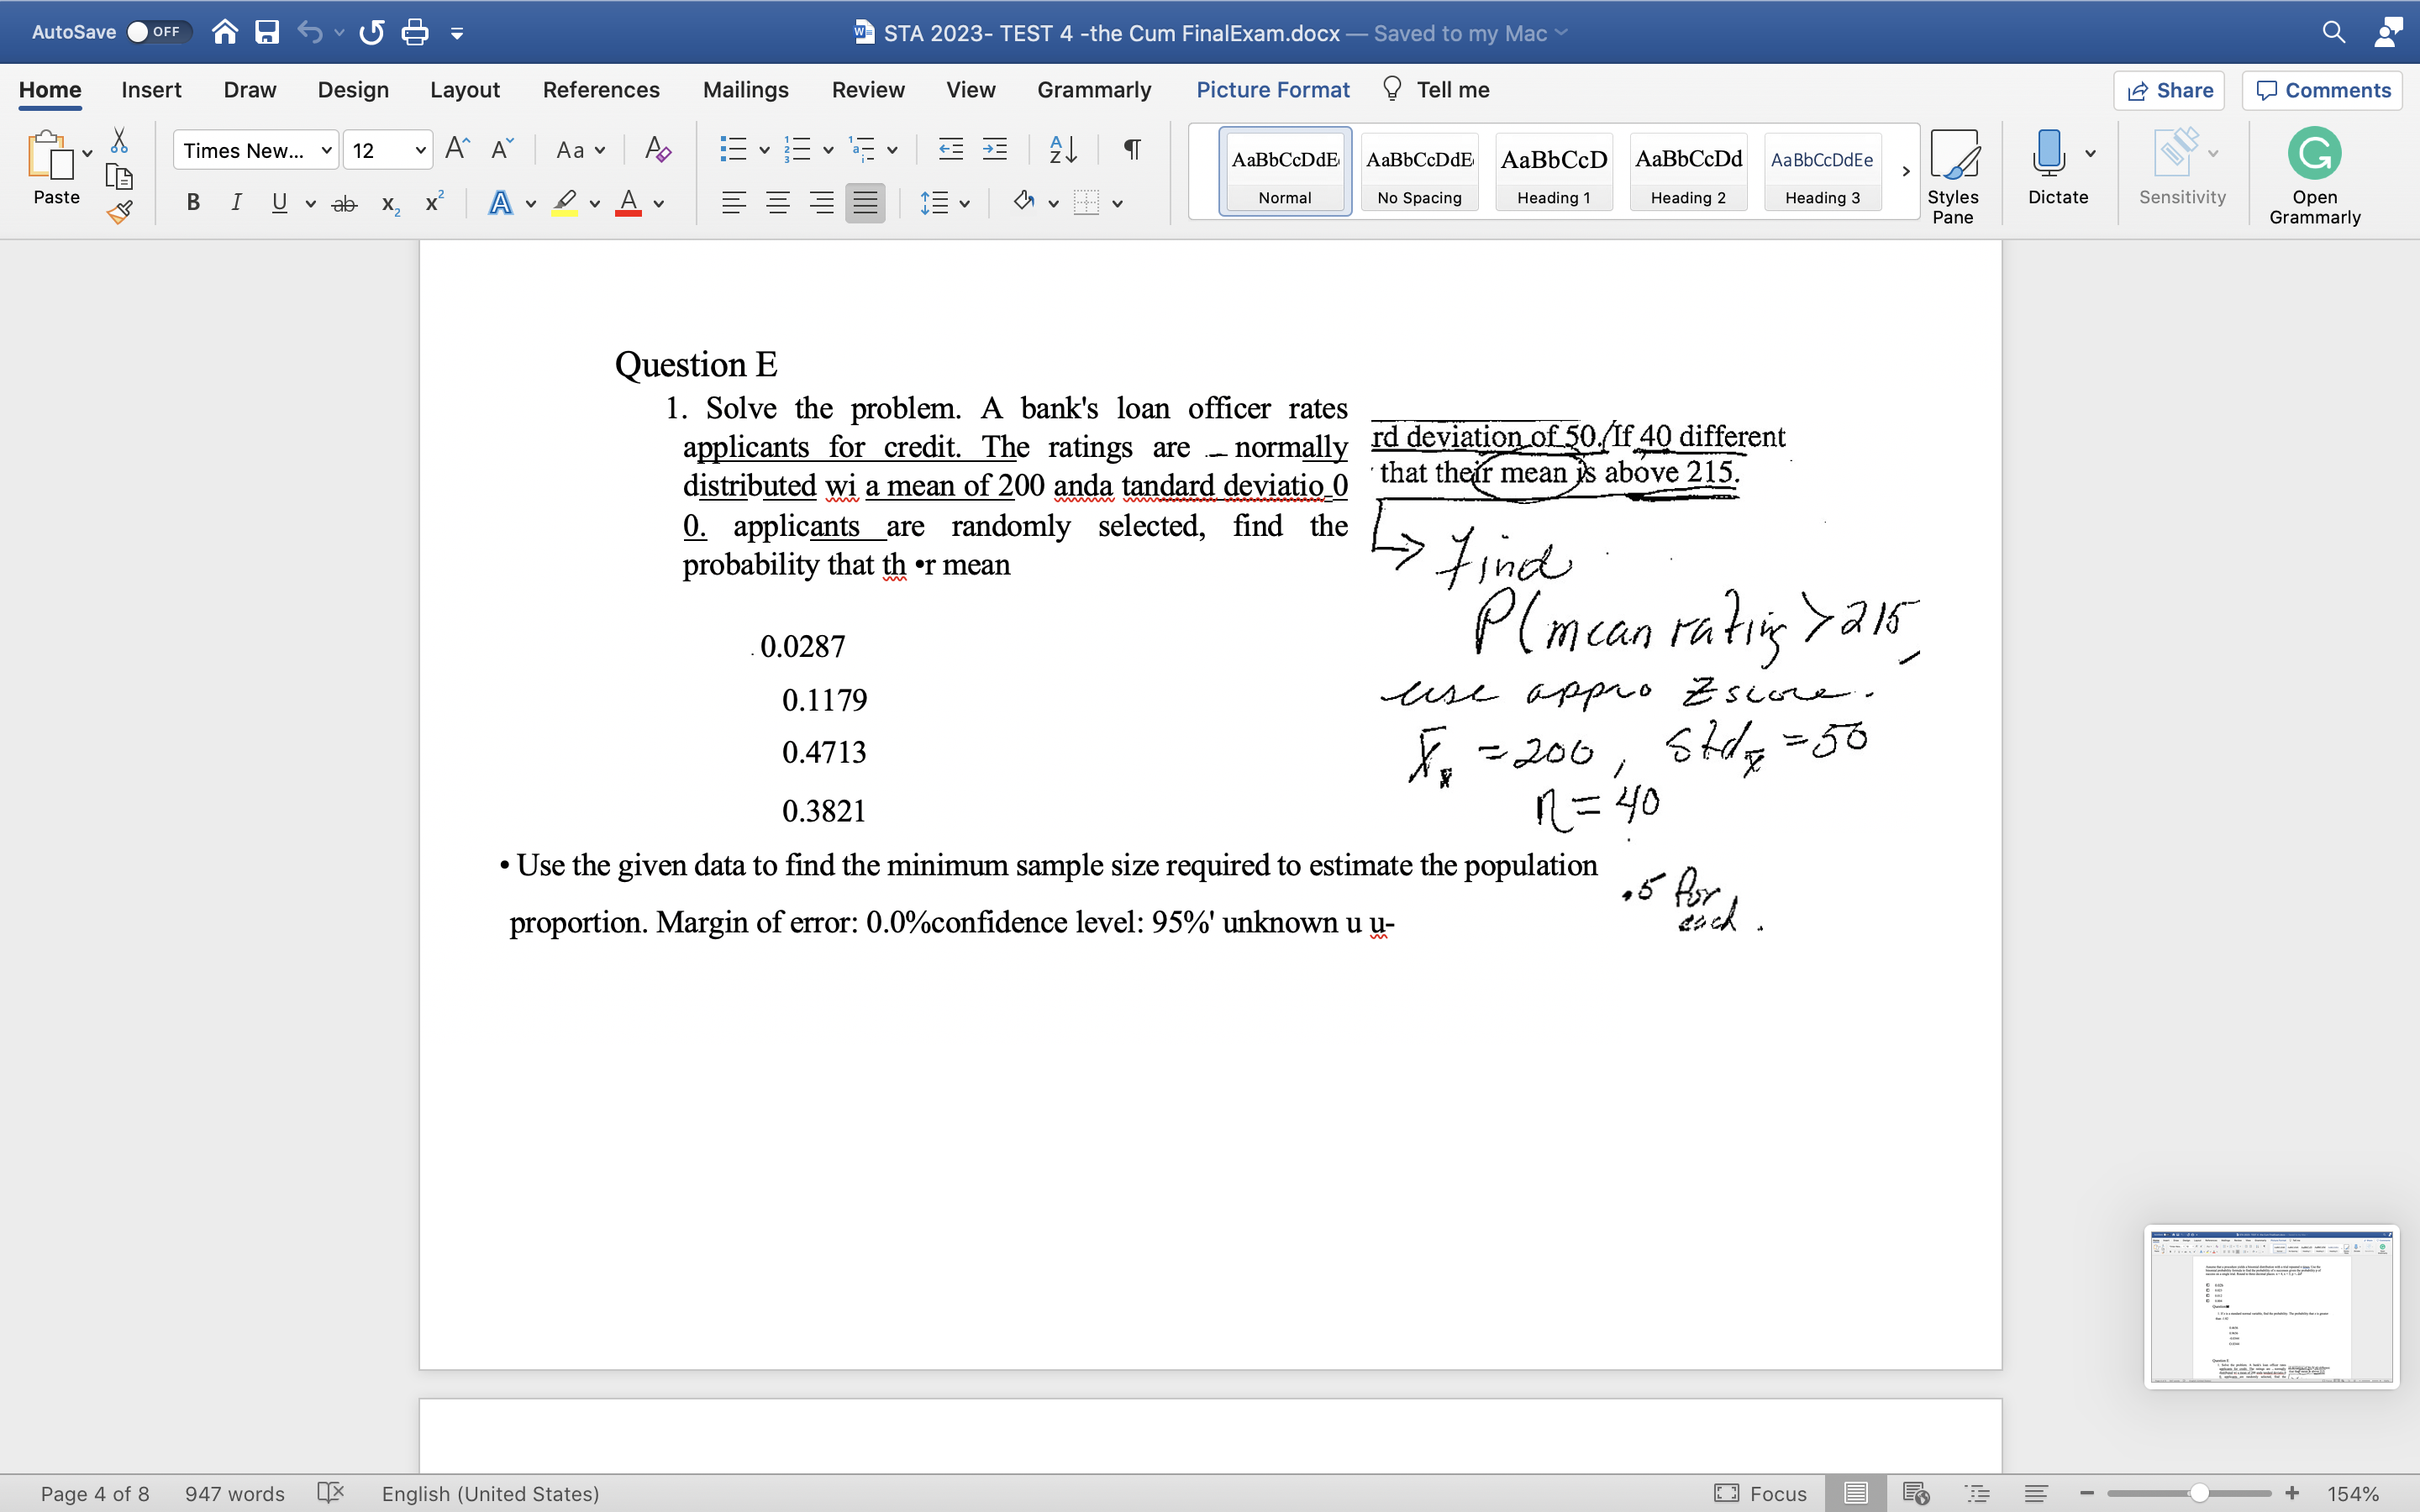
1. Solve the problem. A bank's loan officer rates applicants for credit. The ratings arenormallydistributedwia mean of 200 anda tandard deviatio0 0.applicantsare randomly selected, find the probability that th ?r mean
0.0287
0.1179
0.4713
0.3821
? Use the given data to find the minimum sample size required to estimate the population proportion. Margin of error: 0.0%confidence level: 95%' unknown u u-
36675
45190 46705
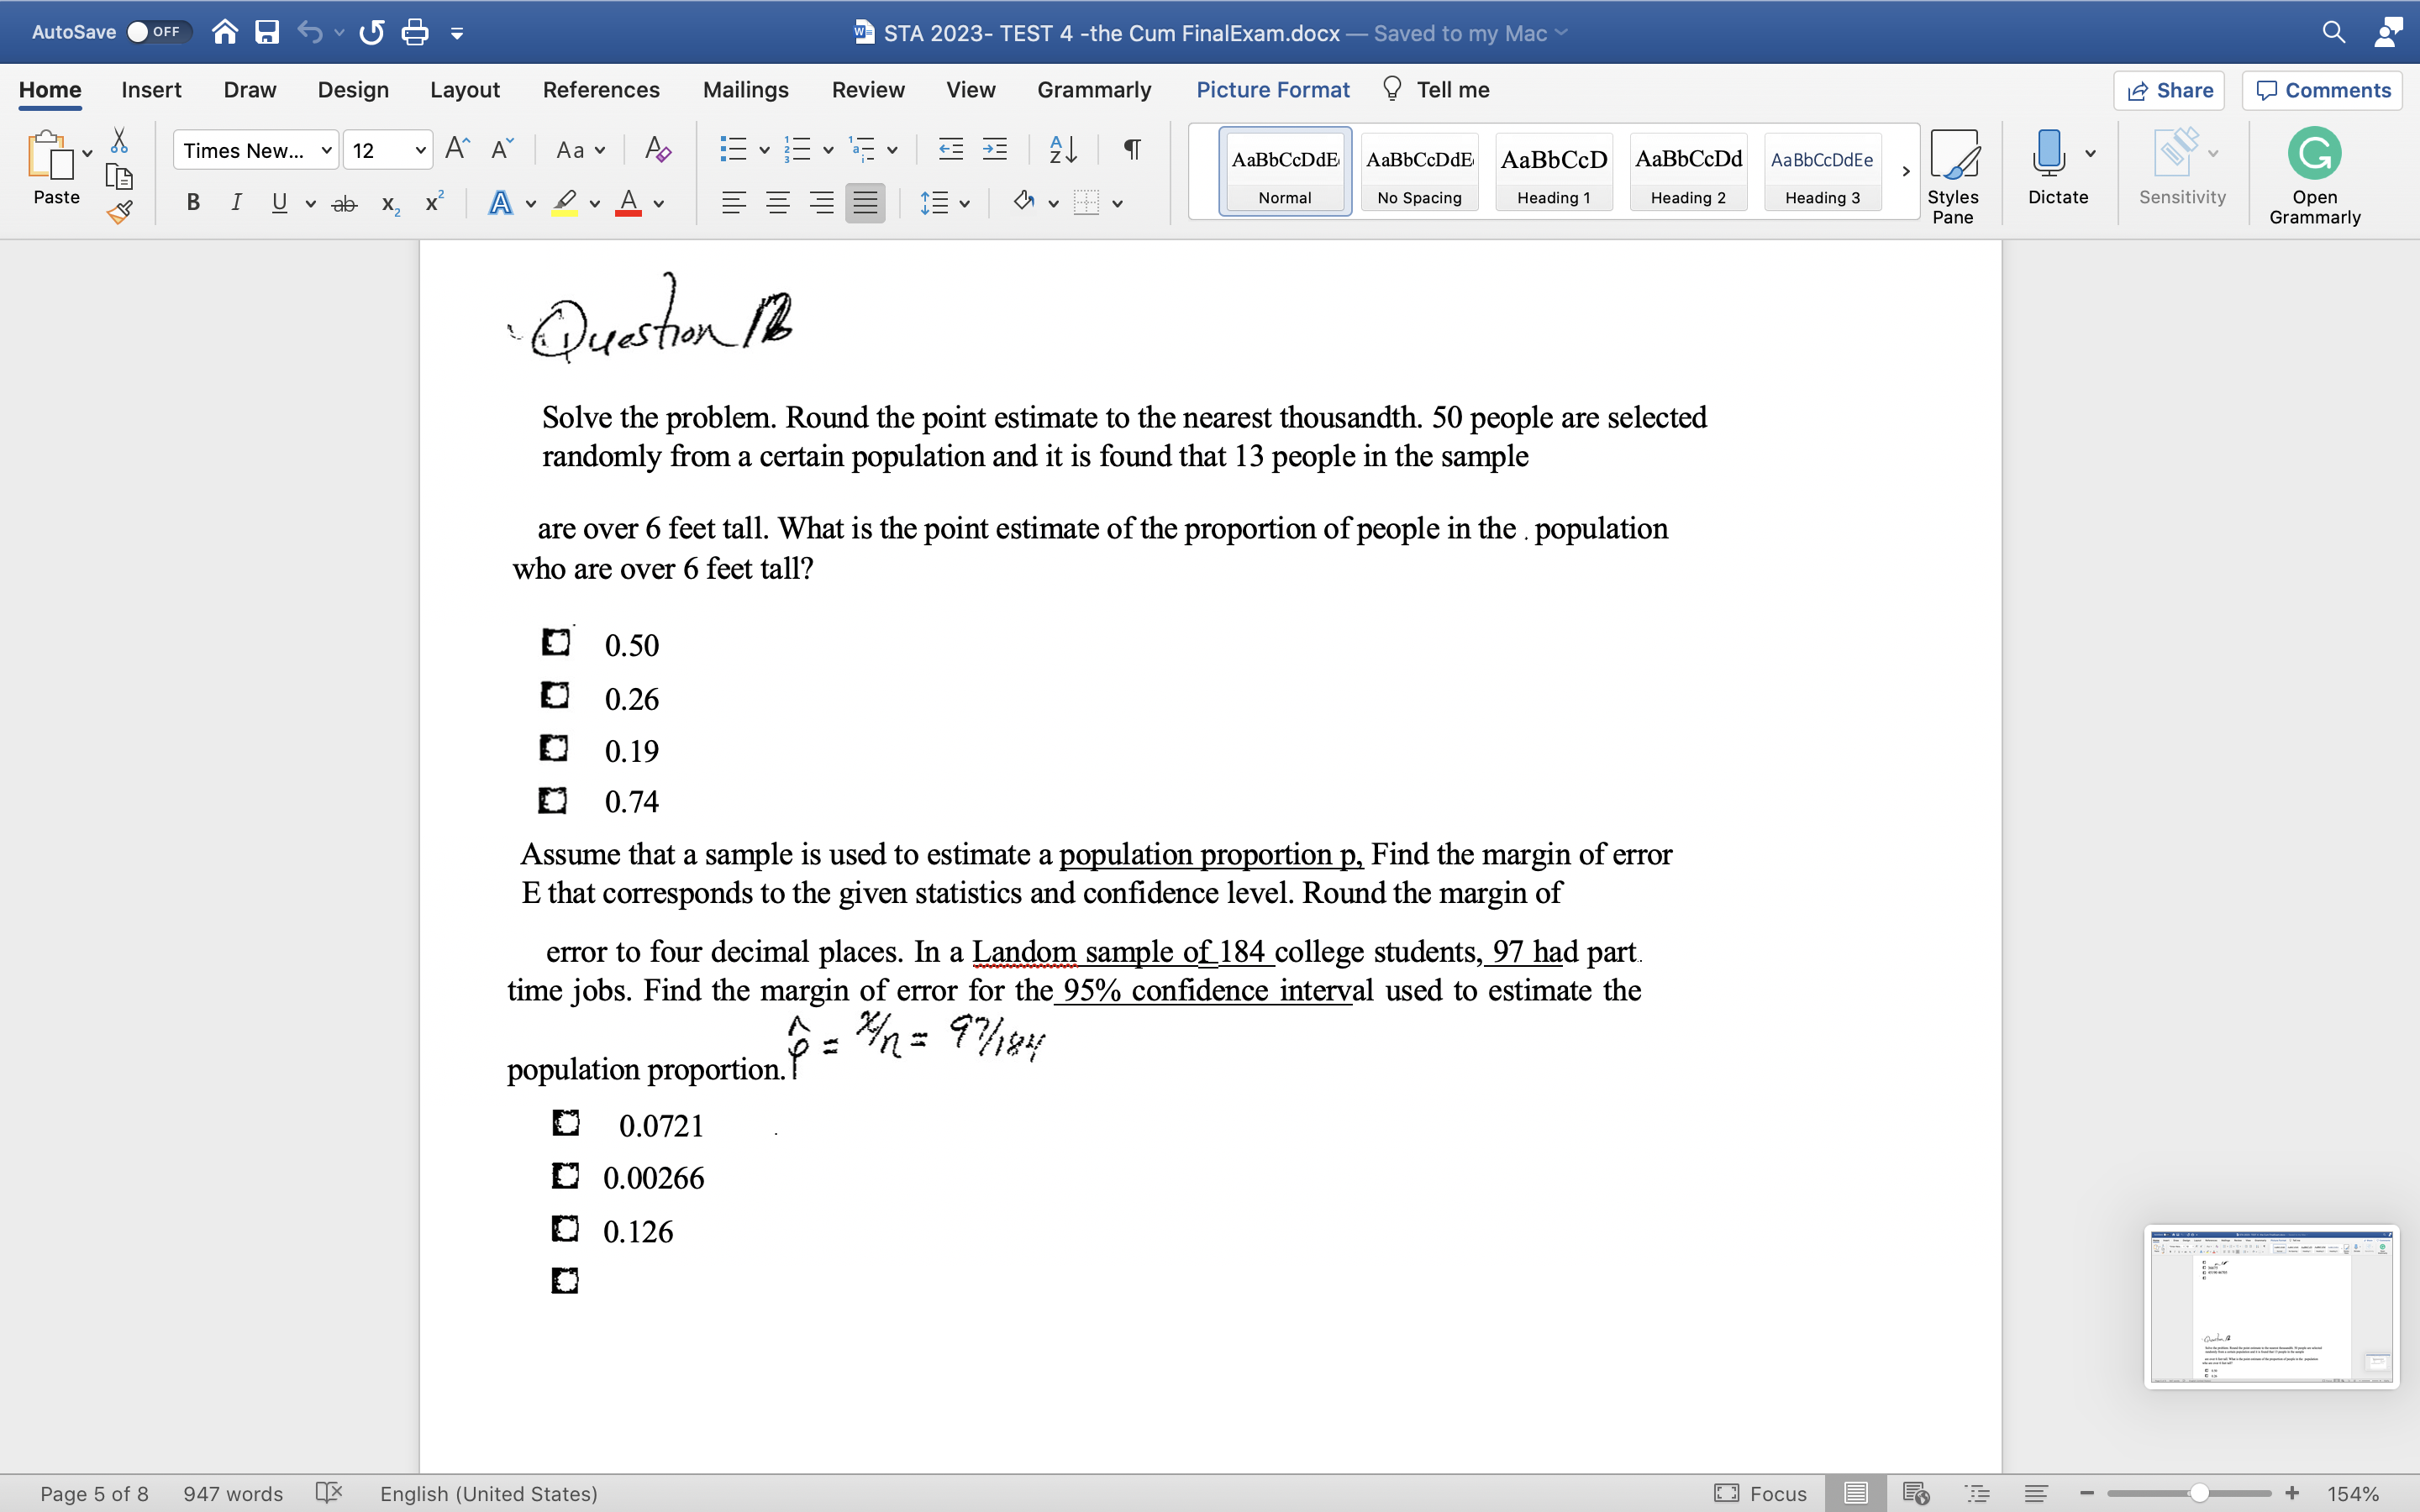
Solve the problem. Round the point estimate to the nearest thousandth. 50 people are selected randomly from a certain population and it is found that 13 people in the sample
are over 6 feet tall. What is the point estimate of the proportion of people in thepopulation who are over 6 feet tall?
0.50
0.26
0.19
0.74
Assume that a sample is used to estimate apopulation proportion p,Find the margin of error E that corresponds to the given statistics and confidence level. Round the margin of
error to four decimal places. In aLandom sample of184college students,97 had parttime jobs. Find the margin of error for the95% confidence interval used to estimate the population proportion.
0.0721
0.00266
0.126
0.0649
Use the given degree of confidence and sample data to construct a confidence interval for the population proportion p. n = 125, x = 72; 90% confidence
0.507
0.503
0.506
0.502
non
Use the confidence level and sample data to find a confidence interval for estimating the population (mu). Round your answer to the same number of decimal places as the sample mean. A random sample of 130 full-grown lobsters had a mean weight of 21 ounces anda standard deviation of 3.0 ounces. Construct a 98% confidence interval for the population mean mu.
21 oz
20 oz
19 oz
Assume that the data has a normal distribution and the number of observations is greater
than fifty. Find the critical z value used to test a null hypothesis.= 0.05 for a lefttailed test.
-1.96 1.96 1.645 -1.645
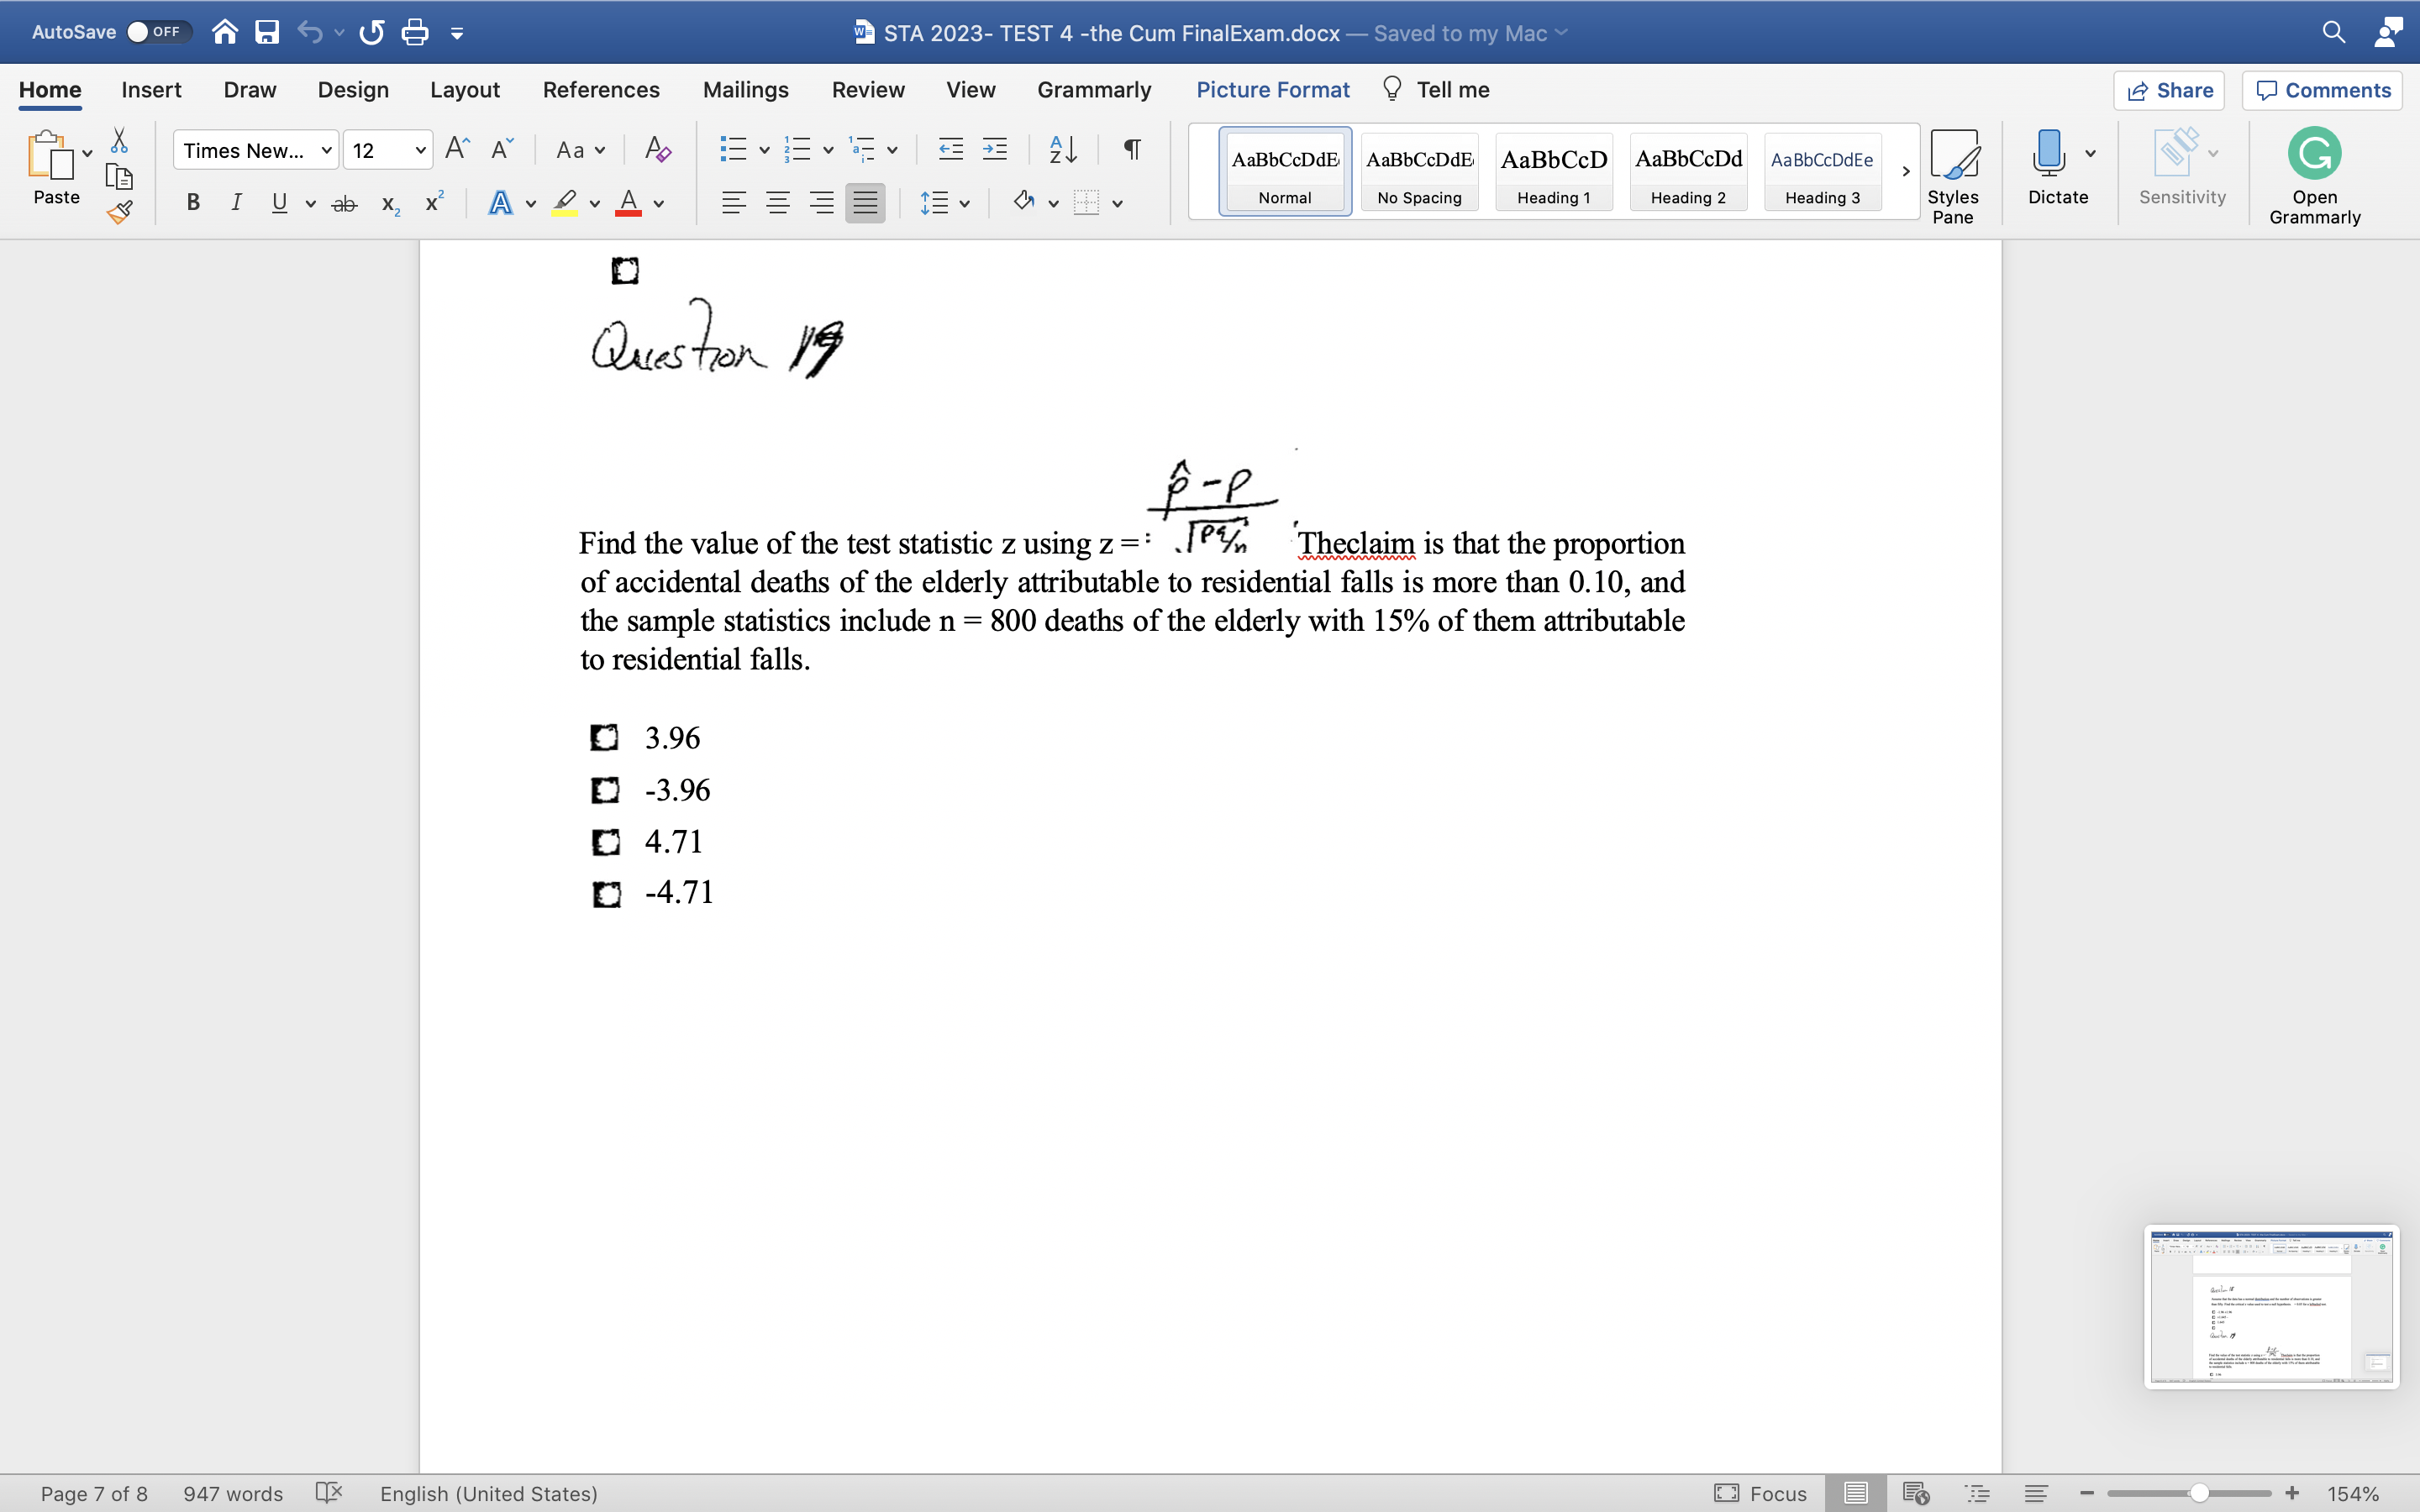
Find the value of the test statistic z using z =Theclaim is that the proportion of accidental deaths of the elderly attributable to residential falls is more than 0.10, and the sample statistics include n = 800 deaths of the elderly with 15% of them attributable to residential falls.
3.96
-3.96
4.71
-4.71
Qua Ion
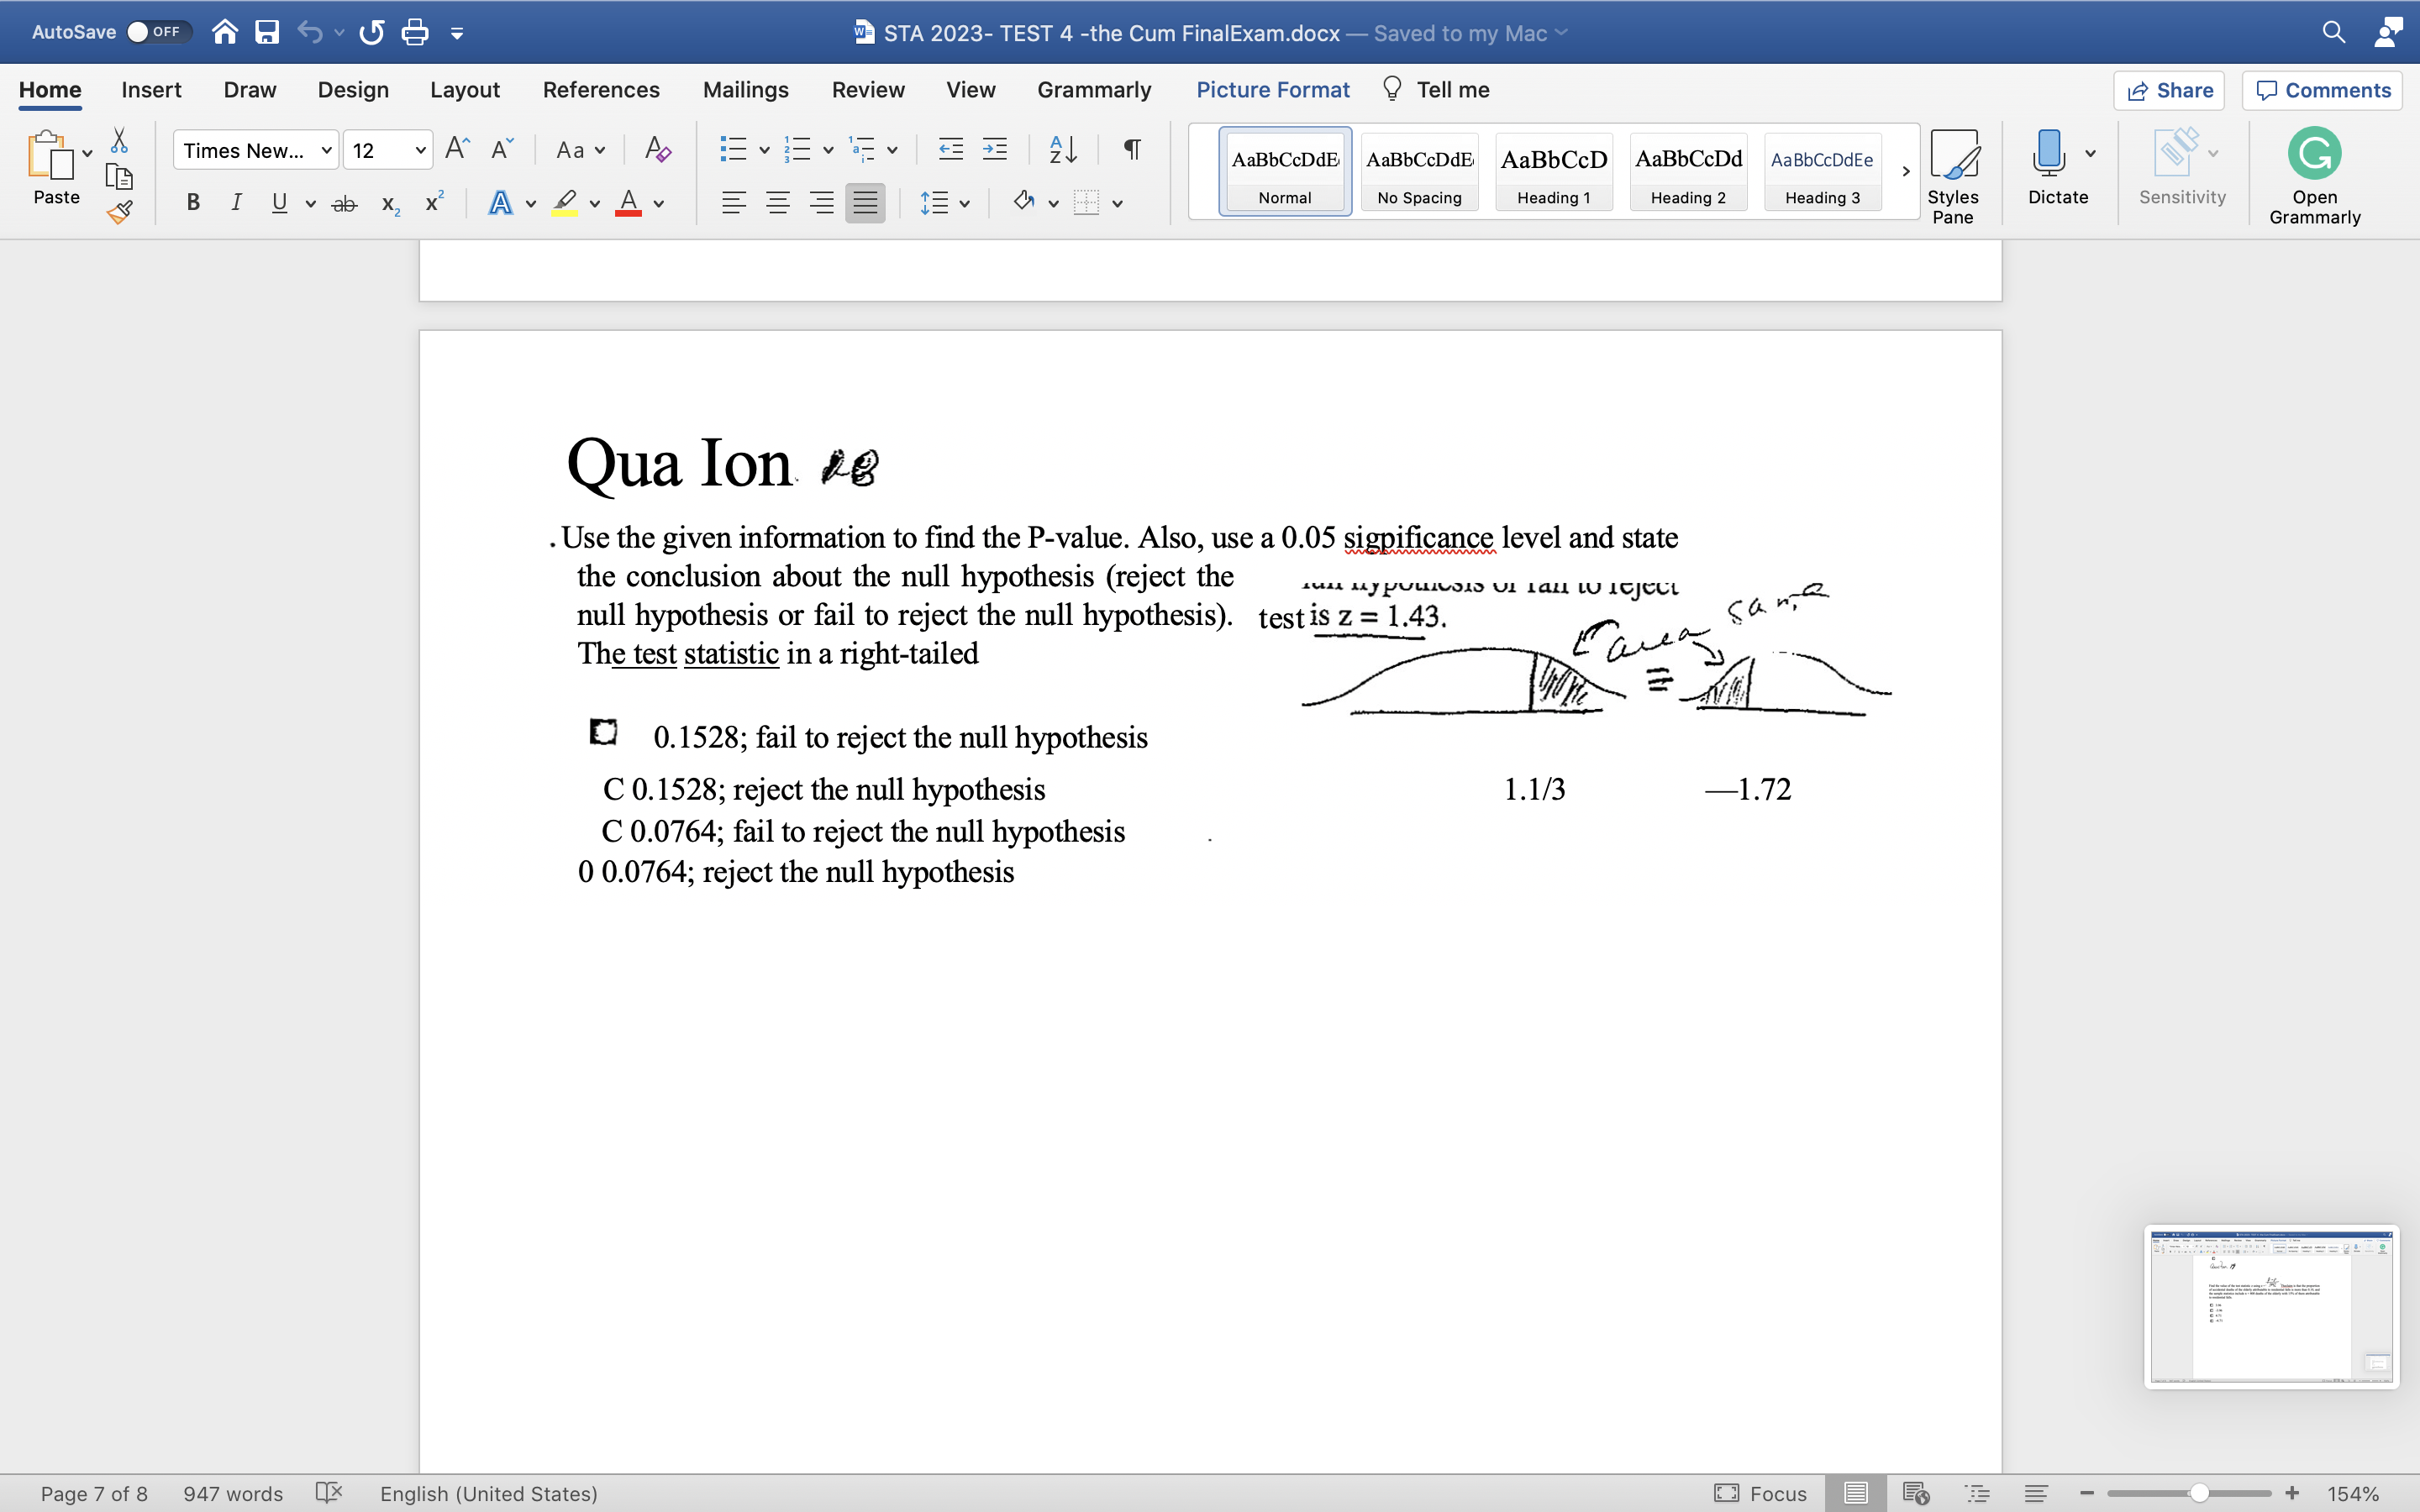
Use the given information to find the P-value. Also, use a 0.05 sigpificance level and state the conclusion about the null hypothesis (reject the null hypothesis or fail to reject the null hypothesis). The teststatisticin a right-tailed
0.1528; fail to reject the null hypothesis
C 0.1528; reject the null hypothesis1.1/3?1.72
C 0.0764; fail to reject the null hypothesis
0 0.0764;
AutoSave OFF wa STA 2023- TEST 4 -the Cum FinalExam.docx - Saved to my Mac Q Home Insert Draw Design Layout References Mailings Review View Grammarly Picture Format Tell me Share Comments Times New... v 12 A" A Aa Ap EEVEEVEE AaBbCcDdE AaBbCcDdE AaBbCcD AaBbCcDd Aa BbCcDdEe Paste BIUvab x x |A DAY Norma No Spacing Heading 1 Heading 2 Heading 3 Styles Dictate Sensitivity Open Pane Grammarly Question 1 1. Find the mean for the given sample data..Unless indicated otherwise, round your answer to one more decimal place than is present in the original data values. The students in Hugh Logan's math class took the Scholastic Aptitude Test. Their math scores are shown 536 608 344 340 5% below. Find the mean score. 357 343 566 470 482 464.2 476.0 473.7 455.1 Question 2 1. Find the midrange for the given sample data. Listed below are the amounts of time (in months) that the employees of an electronics company have been working at the company. Find the midrange. 12 21 26 37 46 53 61 66 75 76 85 91 IQ 155. 63.5 months 71.5 months 66.9 months Page 1 of 8 947 words OX English (United States) Focus + 154%AutoSave OFF wa STA 2023- TEST 4 -the Cum FinalExam.docx - Saved to my Mac Q Home Insert Draw Design Layout References Mailings Review View Grammarly Picture Format Tell me Share Comments Times New... v 12 A A Aa Ap AaBbCcDdE AaBbCcDdE AaBbCcD AaBbCcDd AaBbCcDdEe Paste BI Uvab x x |A DAY Normal No Spacing Heading 1 Heading 2 Heading 3 Styles Dictate Sensitivity Open Pane Grammarly Question 2. 1. Find the midrange for the given sample data. Listed below are the amounts of time (in months) that the employees of an electronics company have been working at the company. Find the midrange. 12 21 26 37 46 53 61 66 75 76 85 91 IQ 155 63.5 months 71.5 months 66.9 months 83.5 months Question 3 1. Find the standard deviation for the given sample data. Round your answer to one more decimal place than is present in the original data.. 4145.12 20.0 21.5 27.4 47.3 131 11.1 . 37.34 Page 1 of 8 947 words X English (United States) Focus E + 154%AutoSave OFF wa STA 2023- TEST 4 -the Cum FinalExam.docx - Saved to my Mac Q Home Insert Draw Design Layout References Mailings Review View Grammarly Picture Format Tell me Share Comments Times New... v 12 A A Aa Ap 24 T AaBbCcDdE AaBbCcDdE AaBbCcD AaBbCcDd AaBbCcDdEe Paste BI Uvab X X A DAY Norma No Spacing Heading 1 Heading 2 Heading 3 Styles Dictate Sensitivity Open Pane Grammarly 37.34 13.11 3285.46 Question 4 1. Find the indicated probability. A bag contains 5 red marbles, 3 blue marbles, and 1 green note: marble. Find P(not blue). I P ( not blue) = 1- P(blue). 1/3 3/2 .6 Question omi 1. Find the indicated probability Round to the nearest thousandth-In a blood testing procedure blood samples from 6 people are combined into one mixture. The mixture will . only fest negative if ALL the individual samples are negative otherwise it will test, positive If the probability that an individual sample tests positive is 0. 11, what is the probability that the mixture will test positive?- 10 09080177 EZZZ1000 -0:503 Page 2 of 8 947 words English (United States) Focus + 154%AutoSave OFF wa STA 2023- TEST 4 -the Cum FinalExam.docx - Saved to my Mac Q Home Insert Draw Design Layout References Mailings Review View Grammarly Picture Format Tell me Share Comments Times New... v 12 A A Aa Ap EVEN Ev T AaBbCcDdE AaBbCcDdE AaBbCcD AaBbCcDd AaBbCcDdEe Paste BI Uvab X X|A DAY Norma No Spacing Heading 1 Heading 2 Heading 3 Styles Dictate Sensitivity Open Pane Grammarly Question 1. Evaluate the expression. 330 1980 5040 C None of the above: Result is Question 1. Assume that a researcher randomly selects 14 newborn babies and counts the number of. girls selected, x. The probabilities corresponding to the 14 possible values of x are summarized in the given table. Answer the question using the table. Probabilities of Girls P(x) P(x) P(x) 0 0.000 U 0.12 10 0.061 0.001 0 102 11 0 02 Page 2 of 8 947 words English (United States) Focus + 154%AutoSave .0\" 'n' E 3 STA 2023 TEST 4 7the Cum FinalExam.docx Home Insert Draw Design Layout References Mailings Review View Grammarly Picture Format 9 Tell me 13 Share 9 Comments [an Vt: Times New". VH 12 v A A Aa v A0 '.' , a, J, 1T [\\anch AaBbCeDdB \"31,ch 'aBchDd AaBchDdEe > Z k!) v :\\\\/ v G Paste B I U V ab x x1 A V p v A ., L V i No Spacing Heading1 HaadingZ Heading: Styles Dictate Sensitivity Open g _ 2 _ _ _ * / Pane Grammarly Question 1. Assume that a researcher randomly selects 14 newborn babies and counts the number of . girls selected, x. The probabilities corresponding to the 14 possible values of x are summarized in the given table. Answer the question using the table. Probabilities of Girls P(x) P(x) P(x) 0.000 5 0,12 10 0.061 0 1 001 6 0.183 11 0.02 2 32;); E7; 0209 12 0.001 3 0.061 9 0'18 is; 95,993 Find the probability of selecting 2 or more girls. 4 0.999 0.006 0.001 0.994 's - (455221077 7 Determine whether the given procedure results in a binomial distribution. If not, state the reason why, Choosing 10 marbles 'om a box of 40 marbles (20 purple, 12 red, and. 8 green) one at a time with replacement, keeping track of the number of red marbles chosen Not binomial: there are more than two outcomes for each trial. n I l . i . . 1 r .1 , Page 30f 8 947 words U} English (United States) D Focus u m III' II\" _ _J + 154% AutoSave OFF wa STA 2023- TEST 4 -the Cum FinalExam.docx - Saved to my Mac Q Home Insert Draw Design Layout References Mailings Review View Grammarly Picture Format Tell me Share Comments Times New... v 12 AaBbCcDdE AaBbCcDdE AaBbCcD AaBbCcDd AaBbCcDdEe Paste BI U vab x X A DAY IEv Norma No Spacing Heading 1 Heading 2 Heading 3 Styles Dictate Sensitivity Open Pane Grammarly Question 7 Determine whether the given procedure results in a binomial distribution. If not, state the reason why. Choosing 10 marbles from a box of 40 marbles (20 purple, 12 red, and. 8 green) one at a time with replacement, keeping track of the number of red marbles chosen. Not binomial: there are more than two outcomes for each trial. Procedure results in a binomial distribution. Not binomial: the trials are not independent. Not binomial: there are too many trials. Question 8 : Page 3 of 8 947 words English (United States) Focus E + 154%AutoSave OFF wa STA 2023- TEST 4 -the Cum FinalExam.docx - Saved to my Mac Q Home Insert Draw Design Layout References Mailings Review View Grammarly Picture Format Tell me Share Comments Times New... v 12 A A Aa Ap EVEvy AaBbCcDdE AaBbCcDdE AaBbCcD AaBbCcDd AaBbCcDdEe Paste BI Uvab X X A DAY Norma No Spacing Heading 1 Heading 2 Heading 3 Styles Dictate Sensitivity Open Pane Grammarly Question 8 : Assume that a procedure yields a binomial distribution with a trial repeated n times. Use the binomial probability formula to find the probability of x successes given the probability p of success on a single trial. Round to three decimal places. n = 4, x = 3, p =. 20 0.02b 0.023 0.012 0.004 Question 1. If z is a standard normal variable, find the probability. The probability that z is greater than -1.82 0.4656 0 0656 Page 3 of 8 947 words English (United States) Focus + 154%AutoSave OFF wa STA 2023- TEST 4 -the Cum FinalExam.docx - Saved to my Mac Q Home Insert Draw Design Layout References Mailings Review View Grammarly Picture Format Tell me Share Comments Times New... v 12 A" A Aa Ap 24 T AaBbCcDdE AaBbCcDdE AaBbCcD AaBbCcDd Aa BbCcDdEe Paste BI Uvab X X A DAY Norma No Spacing Heading 1 Heading 2 Heading 3 Styles Dictate Sensitivity Open Pane Grammarly Assume that a procedure yields a binomial distribution with a trial repeated n times. Use the binomial probability formula to find the probability of x successes given the probability p of success on a single trial. Round to three decimal places. n = 4, x = 3, p =. 20 D 0.02b 0.023 0.012 0.004 Question 1. If z is a standard normal variable, find the probability. The probability that z is greater than -1.82 0.4656 0.9656 -0.0344 0.0344 Question E 1. Solve the problem. A bank's loan officer rates applicants for credit. The ratings are _ normally Id deviation of 50. If 40 different distributed wi a mean of 200 anda tandard deviation0 'that their mean is above 215. 0. applicants are randomly selected, find the Page 4 of 8 947 words X English (United States) Focus + 154%AutoSave OFF wa STA 2023- TEST 4 -the Cum FinalExam.docx - Saved to my Mac Q Home Insert Draw Design Layout References Mailings Review View Grammarly Picture Format Tell me Share Comments Times New... v 12 A A Aa Ap AaBbCcDdE AaBbCcDdE AaBbCcD AaBbCcDd AaBbCcDdEe Paste BI U vab X X|A DAY Norma No Spacing Heading 1 Heading 2 Heading 3 Styles Dictate Sensitivity Open Pane Grammarly Question E 1. Solve the problem. A bank's loan officer rates applicants for credit. The ratings are _ normally rd deviation of 50. If 40 different distributed wi a mean of 200 anda tandard deviation0 'that their mean is above 215. O. applicants are randomly selected, find the probability that th or mean Ly find 0.0287 P (mean rating > 215 0.1179 live appro Zscore. 0.4713 8, = 206, Stdy =50 0.3821 1 = 40 . Use the given data to find the minimum sample size required to estimate the population .5 for proportion. Margin of error: 0.0%confidence level: 95%' unknown u u- zack Page 4 of 8 947 words X English (United States) Focus E + 154%wa STA 2023- TEST 4 -the Cum FinalExam.docx - Saved to my Mac Q AutoSave OFF Home Insert Draw Design Layout References Mailings Review View Grammarly Picture Format Tell me Share Comments Times New... v 12 A A Aa A EVEVEV AaBbCcDdE AaBbCcDdE AaBbCcD AaBbCcDd AaBbCcDdEe Styles Dictate Sensitivity Open Paste BI U vab x X |A DAY IEv Norma No Spacing Heading 1 Heading 2 Heading 3 Pane Grammarly Question /2 Solve the problem. Round the point estimate to the nearest thousandth. 50 people are selected randomly from a certain population and it is found that 13 people in the sample are over 6 feet tall. What is the point estimate of the proportion of people in the . population who are over 6 feet tall? 0.50 0.26 0.19 [ 0.74 Assume that a sample is used to estimate a population proportion p. Find the margin of error E that corresponds to the given statistics and confidence level. Round the margin of error to four decimal places. In a Landom sample of 184 college students, 97 had part. time jobs. Find the margin of error for the 95% confidence interval used to estimate the population proportion. 0.0721 0.00266 D 0.126 + Page 5 of 8 947 words English (United States) Focus E 154%AutoSave OFF wa STA 2023- TEST 4 -the Cum FinalExam.docx - Saved to my Mac Q Home Insert Draw Design Layout References Mailings Review View Grammarly Picture Format Tell me Share Comments Times New... v 12 A A Aav Ap AaBbCcDdE AaBbCcDdE AaBbCcD AaBbCcDd AaBbCcDdEe Paste BI Uvab X X A DAY Normal No Spacing Heading 1 Heading 2 Heading 3 Styles Dictate Sensitivity Open Pane Grammarly Question. 13 . 0.0649 Question 14. Use the given degree of confidence and sample data to construct a confidence interval for the population proportion p. n = 125, x = 72; 90% confidence 0.507
Step by Step Solution
There are 3 Steps involved in it

Get step-by-step solutions from verified subject matter experts