

Question: - Find the process model that fits the data and determine process gain, time constant and delay (show in transfer function form) Using the obtained
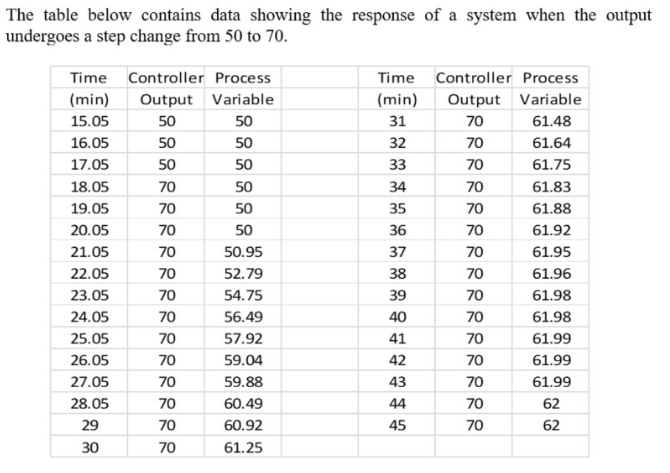
- Find the process model that fits the data and determine process gain, time constant and delay (show in transfer function form) Using the obtained transfer function and the Routh Hurwitz criterion, analyze the dynamics/stability of the process. The table below contains data showing the response of a system when the output undergoes a step change from 50 to 70. 50 31 50 33 Time Controller Process (min) Output Variable 15.05 50 16.05 50 50 17.05 50 18.05 70 50 19.05 70 50 20.05 70 50 21.05 70 50.95 22.05 52.79 23.05 70 54.75 24.05 70 56.49 25.05 70 57.92 26.05 70 59.04 27.05 59.88 28.05 70 60.49 29 70 60.92 30 70 61.25 Time Controller Process (min) Output Variable 70 61.48 32 70 61.64 70 61.75 34 70 61.83 35 70 61.88 36 70 61.92 37 70 61.95 61.96 39 70 61.98 40 70 61.98 41 70 61.99 42 70 61.99 43 61.99 70 62 45 70 70 38 70 %wmm449 RRRRRRR 70 70 62
Step by Step Solution
There are 3 Steps involved in it

Get step-by-step solutions from verified subject matter experts