

Question: Find the sample correlation coefficient and interpret your result. The table below shows the number of absences, x, in a Statistics course and the final
Find the sample correlation coefficient and interpret your result.
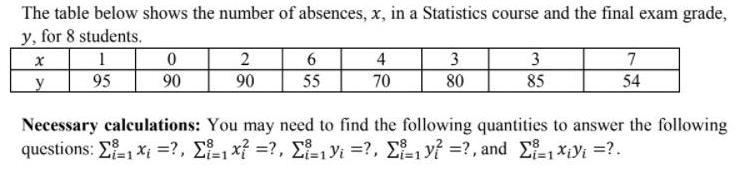
The table below shows the number of absences, x, in a Statistics course and the final exam grade, y, for 8 students. 2 4 y 95 90 90 55 70 80 3 7 85 54 Necessary calculations: You may need to find the following quantities to answer the following questions: E x =?, E x} =?, E-, Yi =?, E1y? =?, and xyi =?. %3D1
Step by Step Solution
★★★★★
3.48 Rating (151 Votes )
There are 3 Steps involved in it
1 Expert Approved Answer
Step: 1 Unlock

Question Has Been Solved by an Expert!
Get step-by-step solutions from verified subject matter experts
Step: 2 Unlock
Step: 3 Unlock