

Question: Find the standard deviation, 5, of sample data summarized in the frequency distribution table below by using the formula below, where x represents the class
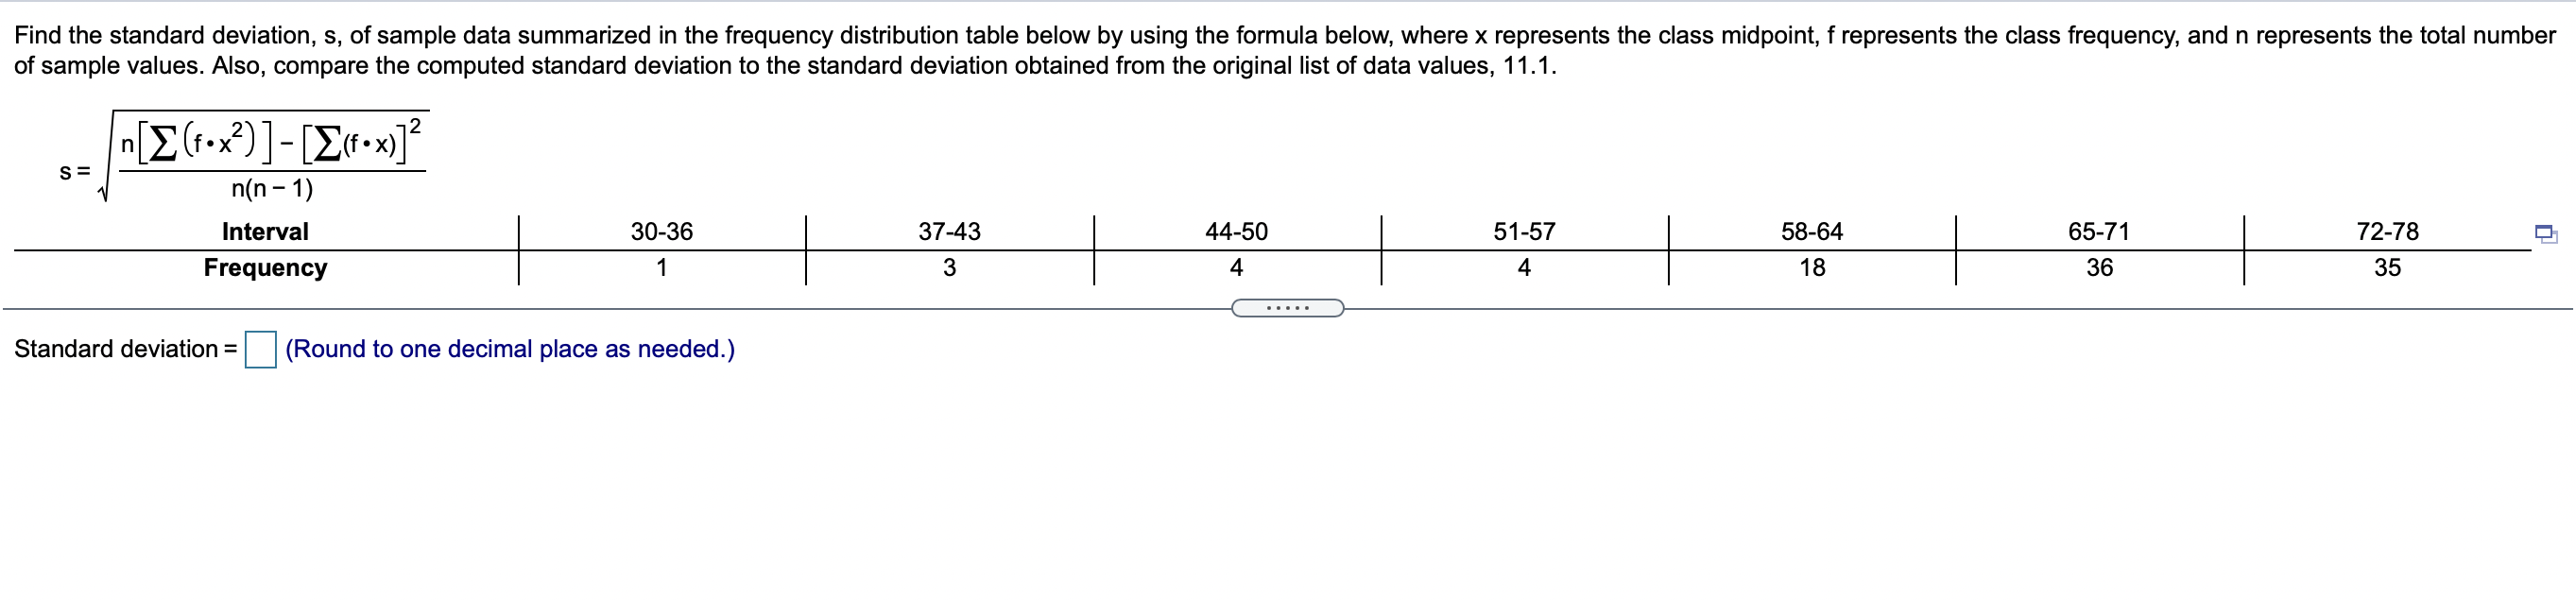
Find the standard deviation, 5, of sample data summarized in the frequency distribution table below by using the formula below, where x represents the class midpoint, f represents the class frequency. and n represents the total number of sample values. Also, compare the computed standard deviation to the standard deviation obtained from the original list of data values, 11.1. n[2 (foxz) E(f~x)]2 n(n - 1) Interval | 30-36 | 3743 | 44-50 | 51-57 | 5M4 | 65-71 | 72-78 % Frequency | 1 | 3 | 4 | 4 | 18 | 36 | 35 Standard deviation = (Round to one decimal place as needed.)
Step by Step Solution
There are 3 Steps involved in it
1 Expert Approved Answer
Step: 1 Unlock

Question Has Been Solved by an Expert!
Get step-by-step solutions from verified subject matter experts
Step: 2 Unlock
Step: 3 Unlock