

Question: Find the test statistic please omework Question 2, 9.2.27-T HW Score: 38.88%, 3.5 of 9 points Part 3 of 6 Points: 0.4 of 1 Save
Find the test statistic please
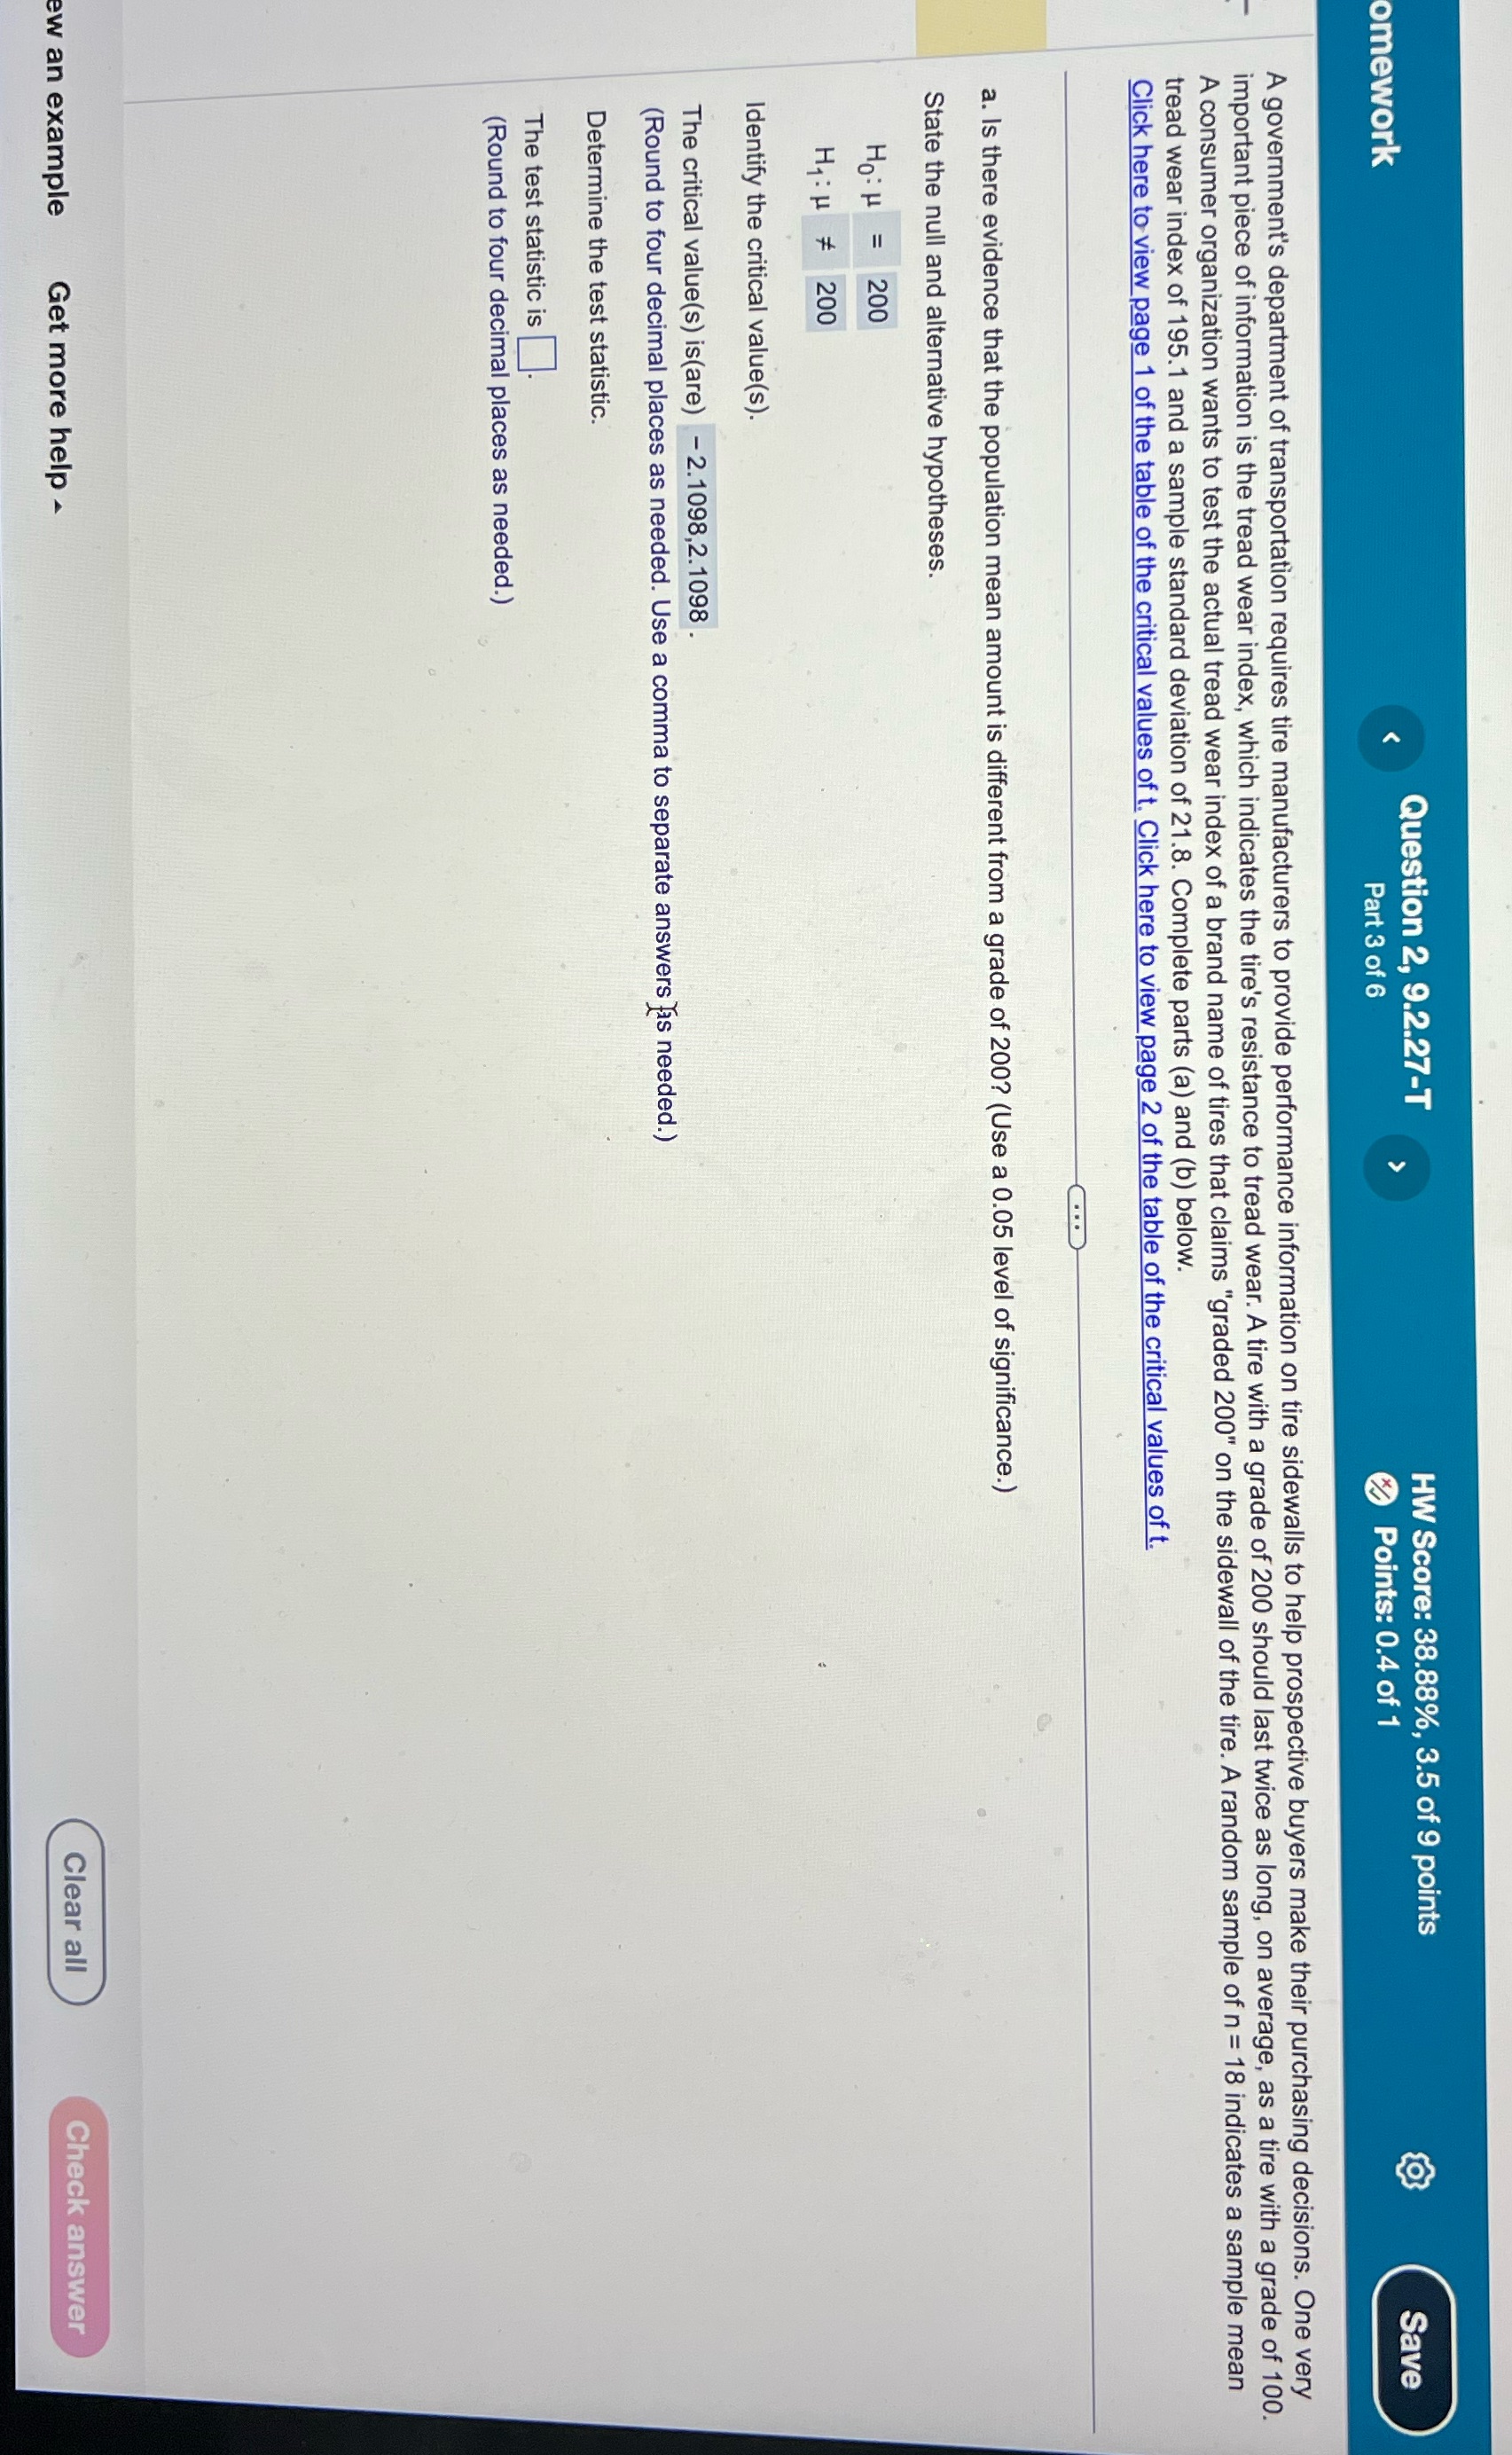
omework Question 2, 9.2.27-T HW Score: 38.88%, 3.5 of 9 points Part 3 of 6 Points: 0.4 of 1 Save A government's department of transportation requires tire manufacturers to provide performance information on tire sidewalls to help prospective buyers make their purchasing decisions. One very important piece of information is the tread wear index, which indicates the tire's resistance to tread wear. A tire with a grade of 200 should last twice as long, on average, as a tire with a grade of 100. A consumer organization wants to test the actual tread wear index of a brand name of tires that claims "graded 200" on the sidewall of the tire. A random sample of n = 18 indicates a sample mean tread wear index of 195.1 and a sample standard deviation of 21.8. Complete parts (a) and (b) below. Click here to view page 1 of the table of the critical values of t. Click here to view page 2 of the table of the critical values of t. a. Is there evidence that the population mean amount is different from a grade of 200? (Use a 0.05 level of significance.) State the null and alternative hypotheses. Ho: H = 200 Hy: u # 200 Identify the critical value(s). The critical value(s) is(are) - 2.1098,2.1098. (Round to four decimal places as needed. Use a comma to separate answers fas needed.) Determine the test statistic. The test statistic is. (Round to four decimal places as needed.) ew an example Get more help - Clear all Check
Step by Step Solution
There are 3 Steps involved in it

Get step-by-step solutions from verified subject matter experts