

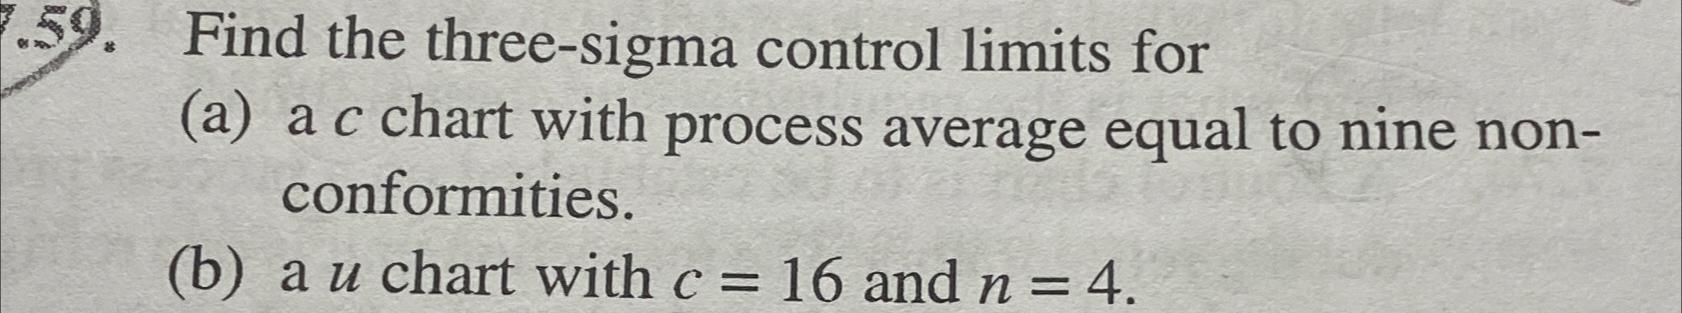
Question: Find the three - sigma control limits for ( a ) a c chart with process average equal to nine nonconformities. ( b ) a
Find the threesigma control limits for
a a chart with process average equal to nine nonconformities.
b a chart with and
Step by Step Solution
There are 3 Steps involved in it
1 Expert Approved Answer
Step: 1 Unlock

Question Has Been Solved by an Expert!
Get step-by-step solutions from verified subject matter experts
Step: 2 Unlock
Step: 3 Unlock